
Copalquin Property
Based on the 2026 NI 43-101 Technical Report, effective June 29, 2026 updated Mineral Resources. and independent modelling by Stormlands Mining
Copalquin Property – Gold Silver- Mithril Silver and Gold Limited
Download the full case study here
Introduction
The Copalquin Property is an advanced gold-silver exploration project located within the historic Copalquin Mining District on the western flank of Mexico’s Sierra Madre Occidental. The property is principally located in the municipality of Tamazula, Durango State, with its north-western portion extending into Badiraguato, Sinaloa State.
The property covers approximately 7,005 hectares. Mithril Silver and Gold Limited currently holds a 50% interest through its wholly owned Mexican subsidiary, Drummond Gold S.A. de C.V., together with an option to acquire the remaining interest. Mithril has been exploring Copalquin since 2020.
In June 2026, Mithril completed an upgraded Mineral Resource Estimate for Target 1, covering the El Refugio and La Soledad mineralised areas. The update represents a significant advancement in geological confidence and mine-planning: the resource is constrained within underground mineable shapes, incorporates internal dilution and is now predominantly classified as Indicated.
Copalquin does not yet have a Preliminary Economic Assessment or other formal economic study. The technical report therefore contains no development CAPEX estimate, production schedule or project valuation.
Stormlands Mining has used the published technical information and its own bench-marked modelling assumptions to examine the potential economics of the Indicated Target 1 resource. Inferred resources and the considerable exploration potential elsewhere on the property have been excluded from the financial model.
The result is not a substitute for a Preliminary Economic Assessment. It is an illustrative assessment of what the existing higher-confidence resource could potentially support under the assumptions modelled.
Key Highlights
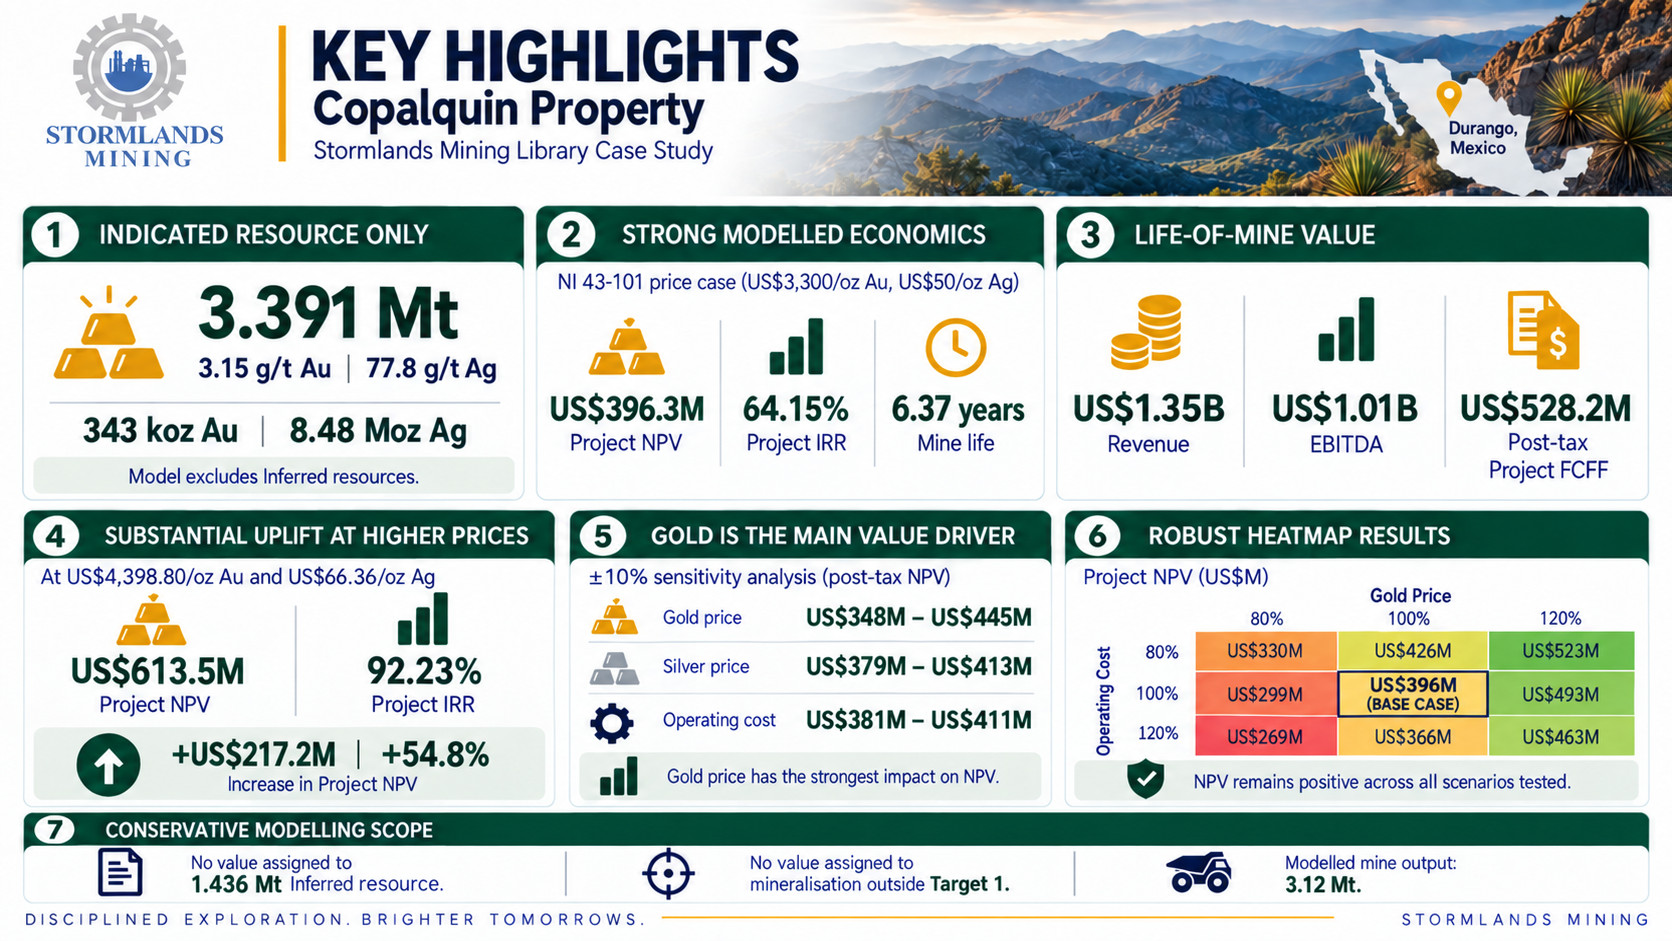
- 3.391 million tonnes of Indicated Resources grading 3.15 g/t gold and 77.8 g/t silver, containing approximately 343,000 oz gold and 8.48 million oz silver.
- Stormlands models approximately 3.12 million tonnes of mine output over 6.37 years, using only the Indicated resource.
- Using the commodity prices from the NI 43-101 (US$3,300/oz gold and US$50/oz silve), the model produces US$396.3 million Project NPV and 64.15% Project IRR.
- Life-of-mine revenue is approximately US$1.35 billion, generating approximately US$1.01 billion of EBITDA and US$528.2 million of post-tax Project free cash flow.
- Using current commodity prices (Average of August 2026) US$4,398.80/oz gold and US$66.36/oz silver, Project NPV increases to US$613.5 million and Project IRR to 92.23%.
- The ±10% sensitivity analysis identifies gold price as the most important individual driver of Project NPV.
- The wider heatmap analysis shows Project NPV remaining positive across every combination tested between 80% and 120% of base gold or silver prices and operating costs.
- The model attributes no economic value to the 1.436 million tonnes of Inferred Resources or to mineralisation outside Target 1.
Project Overview
Mining at Copalquin has a long history. Modern exploration accelerated after Mithril acquired Sun Minerals in 2020. Between 2020 and the June 2026 resource effective date, Mithril completed 320 diamond drill holes totalling approximately 83,764 metres. Exploration has also included extensive surface and underground sampling, geological mapping, LiDAR surveys, aerial magnetics, petrography, fluid-inclusion work and geochronology.
Although drilling has been concentrated on Target 1, the property contains numerous historic mines, prospects and mineralised structures distributed across the wider district.
That distinction is important when considering the Stormlands model: the economic analysis is based on only a relatively small part of the broader Copalquin property.
2026 Mineral Resource
The June 29, 2026 Target 1 Mineral Resource Estimate represents an important advancement from the earlier resource.
The resource comprises:
| Resource category | Tonnes | Gold | Silver | AuEq | Contained gold | Contained silver | Contained AuEq |
| Indicated | 3.391 Mt | 3.15 g/t | 77.8 g/t | 4.26 g/t | 343 koz | 8.479 Moz | 464 koz |
| Inferred | 1.436 Mt | 2.23 g/t | 73.6 g/t | 3.28 g/t | 103 koz | 3.398 Moz | 151 koz |
Approximately 75% of the gold-equivalent ounces in the Target 1 resource are therefore now in the Indicated category.
This is particularly relevant for Stormlands’ modelling approach. Rather than applying economic assumptions to the entire Mineral Resource, the model excludes the Inferred material entirely and starts with the 3.391 Mt Indicated resource.
The Inferred resource may ultimately have economic relevance, but it has a lower level of geological confidence and is not included in the Stormlands valuation.
Metallurgy and Potential Processing Route
Preliminary metallurgical testing provides encouraging results for both gold and silver.
The resource work assumes metallurgical recoveries of 96% for gold and 91% for silver.
There are, however, limitations. The technical report recommends additional metallurgical work, including comminution testing, flotation and cyanidation optimisation and variability testing across different veins and target areas. Recoveries should consequently be regarded as preliminary rather than definitive project-design parameters.
Stormlands Model
Modelling Approach
The technical report provides considerably more information for economic screening than a conventional early-stage Mineral Resource. In particular, it specifies the proposed underground mining method, mining recovery, metallurgical recoveries and the operating-cost assumptions used to establish reasonable prospects for eventual economic extraction.
However, no formal mine plan or economic analysis has yet been completed.
Stormlands has therefore combined the published technical inputs with its own benchmarked assumptions for parameters not yet established by engineering studies.
The model uses only the Indicated Resource. Applying the 92% mining recovery used in the technical report produces approximately 3.120 million tonnes of modelled mine output.
Annual ore production is modelled at approximately 490,000 tonnes, giving a mine life of approximately 6.37 years.
The principal base-case assumptions and outputs are summarised below.
| Model input | Base case |
| Indicated Resource | 3.391 Mt |
| Modelled mine output | 3.120 Mt |
| Gold grade | 3.15 g/t |
| Silver grade | 77.8 g/t |
| Gold price | US$3,300/oz |
| Silver price | US$50/oz |
| Gold recovery | 96% |
| Silver recovery | 91% |
| Annual production | 490,000 tpa |
| Mine life | 6.37 years |
| Initial CAPEX | US$160.0m |
| Operating cost | US$97/t |
| Discount rate | 5% |
| Commercial royalty | 2.5% |
The US$3,300/oz gold and US$50/oz silver prices used are the prices used in the technical report’s 2026 resource work and therefore provide the natural starting point for the Stormlands base case.
Base-case economics
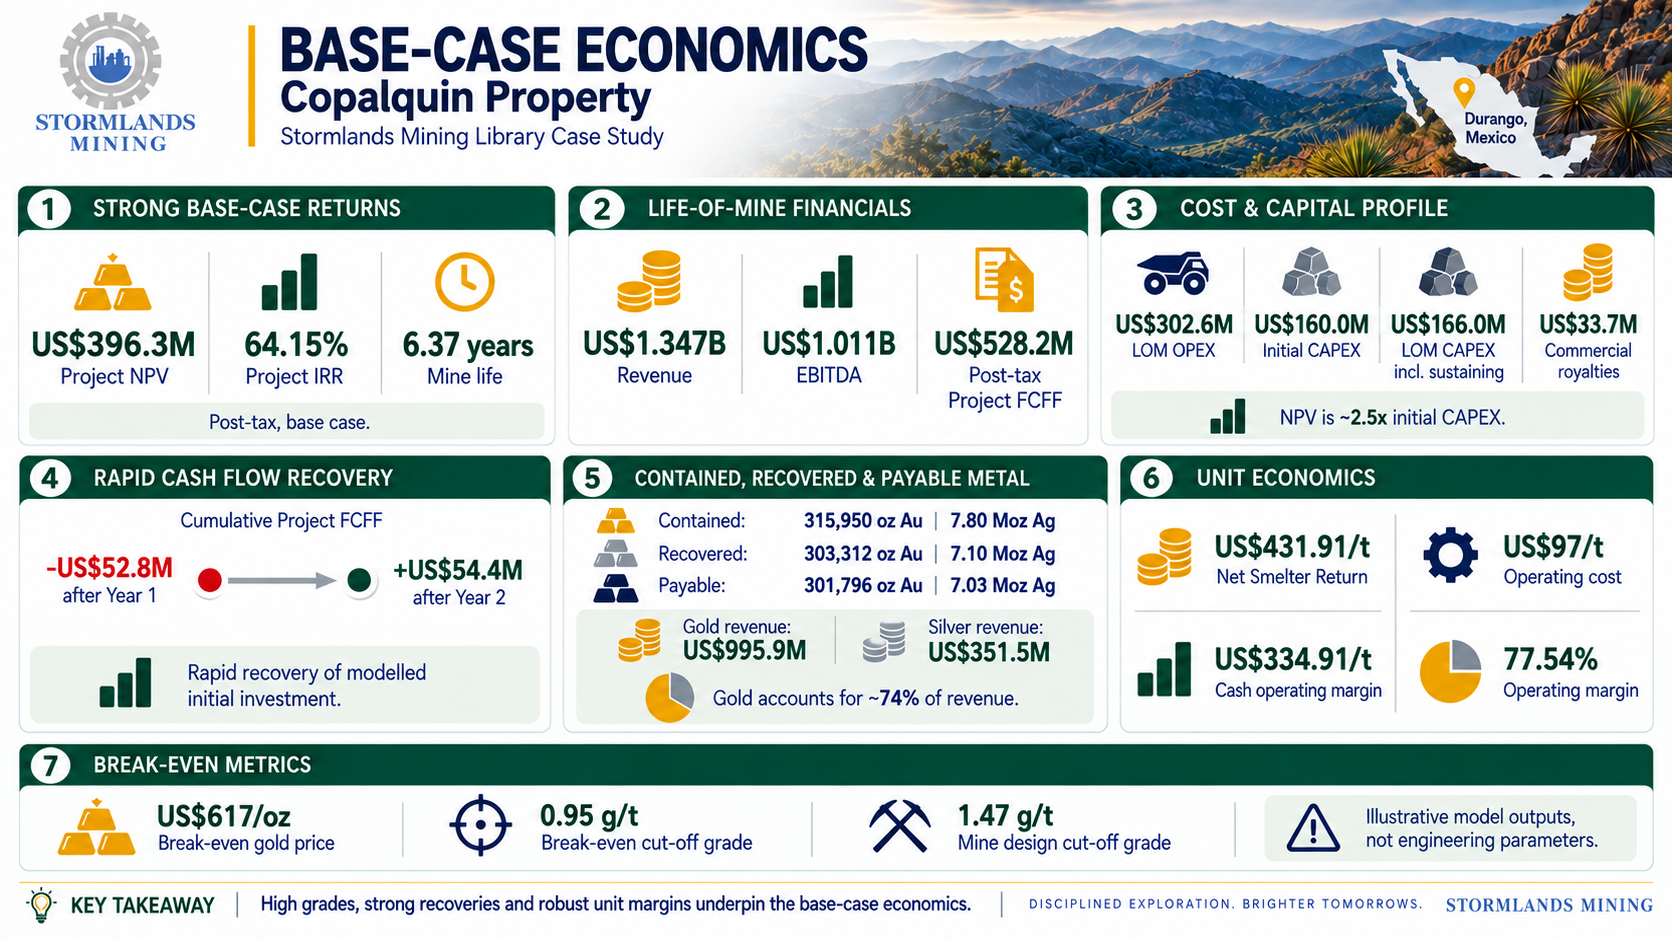
Stormlands’ base case produces a post-tax Project NPV of US$396.3 million and Project IRR of 64.15%.
Life-of-mine revenue totals approximately US$1.347 billion.
Against this revenue, the model generates approximately US$302.6 million of life-of-mine operating expenditure and US$166.0 million of life-of-mine capital expenditure, including sustaining CAPEX.
Commercial royalties amount to approximately US$33.7 million.
The resulting modelled life-of-mine EBITDA is approximately US$1.011 billion, with EBIT of approximately US$845.1 million. Corporate income tax over the modelled mine life totals approximately US$316.9 million, leaving approximately US$528.2 million of post-tax Project free cash flow.
| Financial metric | Base case |
| Mine life | 6.37 years |
| LOM Revenue | US$1.347bn |
| LOM OPEX | US$302.6m |
| Initial CAPEX | US$160.0m |
| LOM CAPEX incl. sustaining | US$166.0m |
| Commercial royalties | US$33.7m |
| LOM EBITDA | US$1.011bn |
| LOM EBIT | US$845.1m |
| Corporate Income Tax | US$316.9m |
| Post-tax Project FCFF | US$528.2m |
| Project NPV | US$396.3m |
| Project IRR | 64.15% |
The Project NPV is approximately 2.5 times the modelled US$160 million initial CAPEX.
The workbook’s annual cash-flow schedule also shows cumulative Project free cash flow moving from approximately negative US$52.8 million after the first operating year to positive US$54.4 million after the second, indicating relatively rapid recovery of the modelled initial investment.
These results are primarily a function of the combination of comparatively high grades, strong metallurgical recoveries, the commodity prices assumed in the resource work and the operating-cost framework applied to the underground resource.
Contained, Recovered and Payable Metal
The modelled 3.120 Mt mine output contains approximately 315,950 oz of gold and 7.80 million oz of silver.
After applying metallurgical recoveries, the model generates approximately 303,312 oz of recovered gold and 7.10 million oz of recovered silver.
Payable production is approximately 301,796 oz of gold and 7.03 million oz of silver over the modelled mine life.
At the base commodity prices, gold contributes approximately US$995.9 million of revenue and silver approximately US$351.5 million.
Gold therefore accounts for approximately three quarters of modelled revenue, helping explain why gold-price movements have a considerably greater impact on Project NPV than equivalent percentage movements in silver price.
Unit Economics
The workbook calculates a base-case Net Smelter Return of approximately US$431.91 per tonne of ore.
Against an operating cost of US$97/t, this produces a modelled cash operating margin of US$334.91/t, equivalent to an operating margin of approximately 77.54%.
These unit economics are a major driver of the model’s financial results. The resource combines high gold grades with a substantial silver credit, while the operating-cost assumption remains relatively small compared with the modelled revenue per tonne.
The workbook also calculates a base-case break-even gold price of approximately US$617/oz, based on the other model assumptions and the contribution from silver. The corresponding break-even gold cut-off grade is approximately 0.95 g/t, compared with a modelled mine-design cut-off grade of approximately 1.47 g/t.
These values are outputs of the illustrative model rather than parameters established through detailed mine design and should be interpreted accordingly.
Current Commodity-price scenario
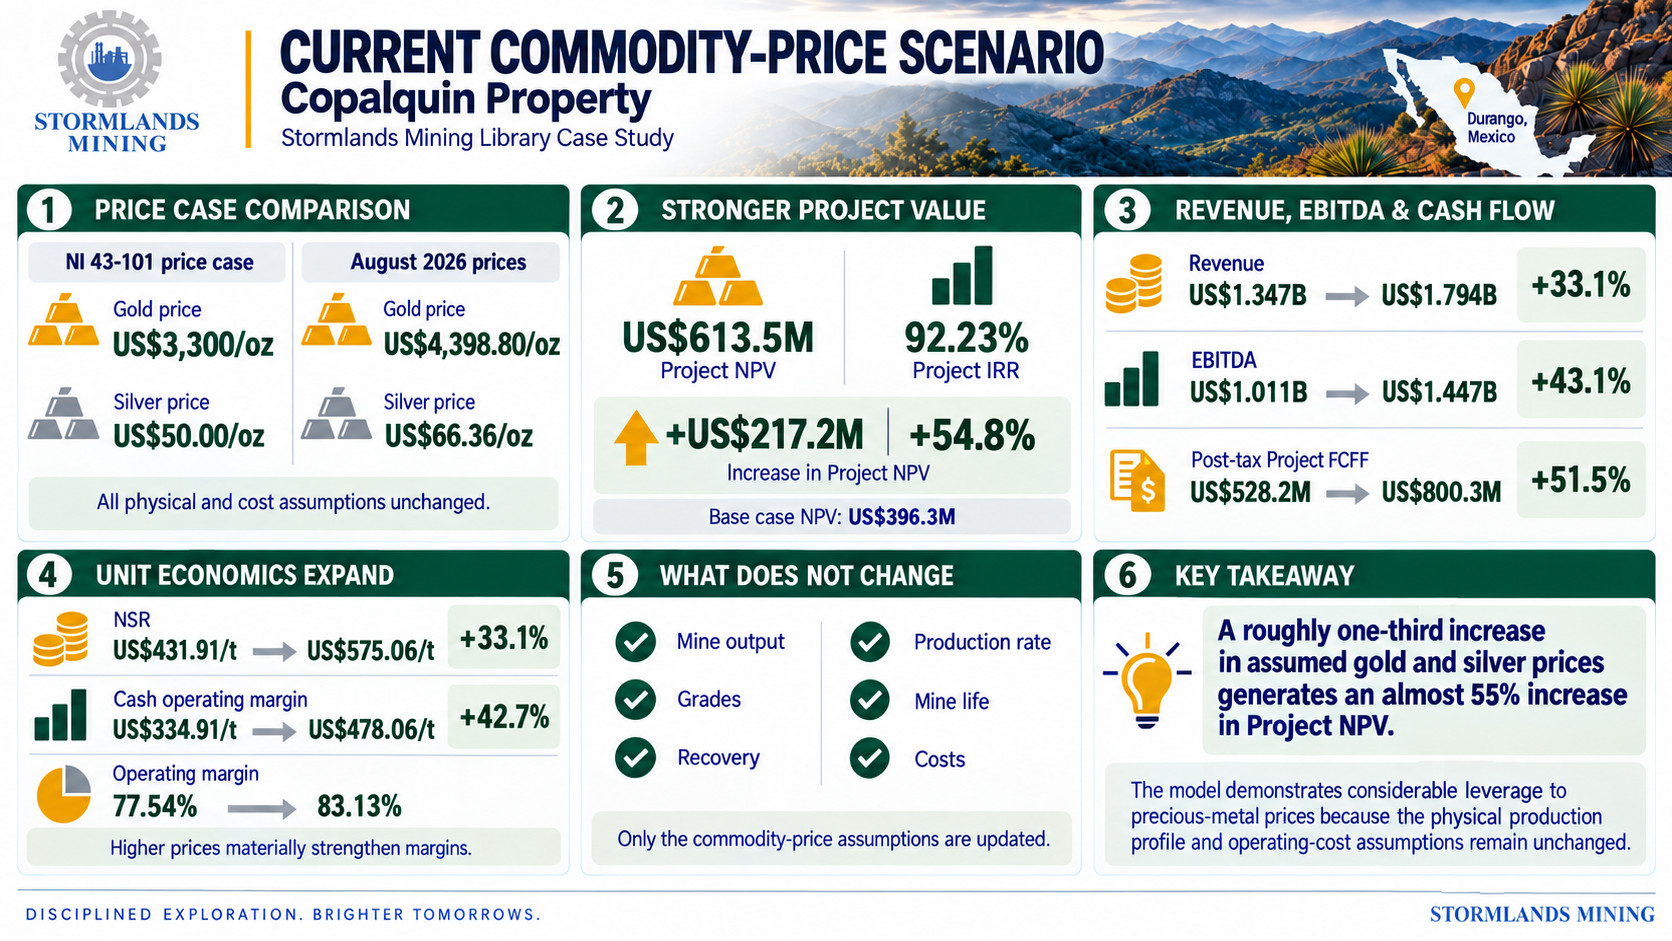
Stormlands has also modelled the same project using August 2026 commodity prices of US$4,398.80/oz gold and US$66.36/oz silver.
Nothing else in the model changes. Mine output, grades, recovery, production rate, mine life and costs remain identical to the base case.
The effect on project value is substantial.
Life-of-mine revenue rises from approximately US$1.347 billion to US$1.794 billion, an increase of approximately US$446.6 million or 33%.
Because the physical production profile and operating-cost assumptions remain unchanged, a large portion of this additional revenue flows through to earnings and cash flow.
Life-of-mine EBITDA increases by approximately US$435.4 million to US$1.447 billion.
Post-tax Project free cash flow increases from approximately US$528.2 million to US$800.3 million.
Most notably, Project NPV increases by approximately US$217.2 million, or almost 55%, to US$613.5 million. Project IRR rises from 64.15% to 92.23%.
| Financial metric | NI 43-101 price case | August 2026 prices | Change |
| Gold price | US$3,300/oz | US$4,398.80/oz | +33.3% |
| Silver price | US$50.00/oz | US$66.36/oz | +32.7% |
| LOM Revenue | US$1.347bn | US$1.794bn | +33.1% |
| LOM EBITDA | US$1.011bn | US$1.447bn | +43.1% |
| Post-tax Project FCFF | US$528.2m | US$800.3m | +51.5% |
| Project NPV | US$396.3m | US$613.5m | +54.8% |
| Project IRR | 64.15% | 92.23% | +28.08 pts |
| NSR | US$431.91/t | US$575.06/t | +33.1% |
| Cash operating margin | US$334.91/t | US$478.06/t | +42.7% |
The operating margin expands from 77.54% to 83.13%.
The price scenario demonstrates the project’s considerable leverage to precious-metal prices: a roughly one-third increase in the assumed metal prices generates an almost 55% increase in NPV.
Sensitivity Analysis
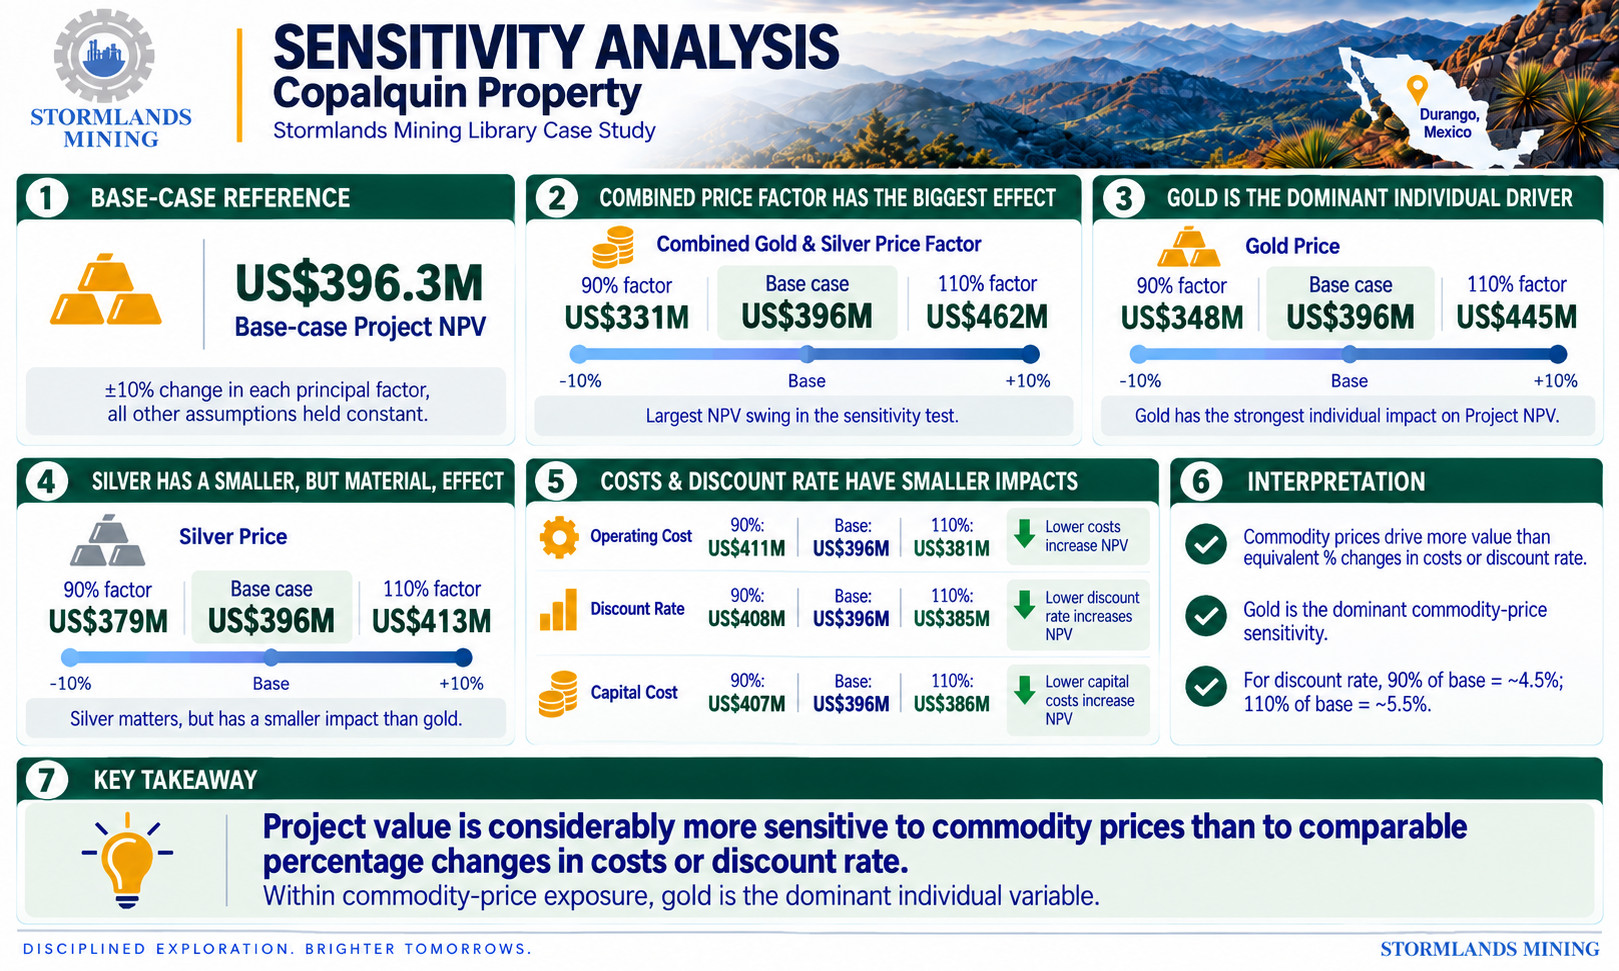
Stormlands tested Project NPV against a ±10% change in each principal model factor, with all other assumptions held constant.
The sensitivity analysis uses the US$396.3 million base-case Project NPV as its reference point.
The largest change occurs when both commodity prices move together. Reducing the combined price factor by 10% decreases Project NPV to approximately US$331 million, while a 10% increase raises NPV to approximately US$462 million.
Gold is the most important individual sensitivity. A 10% reduction in gold price decreases NPV to approximately US$348 million, while a 10% increase raises it to approximately US$445 million.
Silver has a smaller, although still material, effect. A 10% decrease produces an NPV of approximately US$379 million and a 10% increase approximately US$413 million.
Operating costs, CAPEX and discount rate have progressively smaller impacts within the ±10% range tested.
| Factor | Factor at 90% | Base case | Factor at 110% |
| Combined price factor | US$331m | US$396m | US$462m |
| Gold price | US$348m | US$396m | US$445m |
| Silver price | US$379m | US$396m | US$413m |
| Operating cost | US$411m | US$396m | US$381m |
| Discount rate | US$408m | US$396m | US$385m |
| Capital cost | US$407m | US$396m | US$386m |
For operating costs and capital costs, the direction is reversed: reducing the factor increases Project NPV, while increasing it reduces Project NPV.
For the discount-rate sensitivity, 90% of the base factor corresponds to a discount rate of approximately 4.5%, while 110% corresponds to approximately 5.5%.
The key conclusion is clear: Project value is considerably more sensitive to commodity prices than to equivalent percentage movements in costs or discount rate.
Within the commodity-price exposure, gold is the dominant individual variable.
Heatmaps
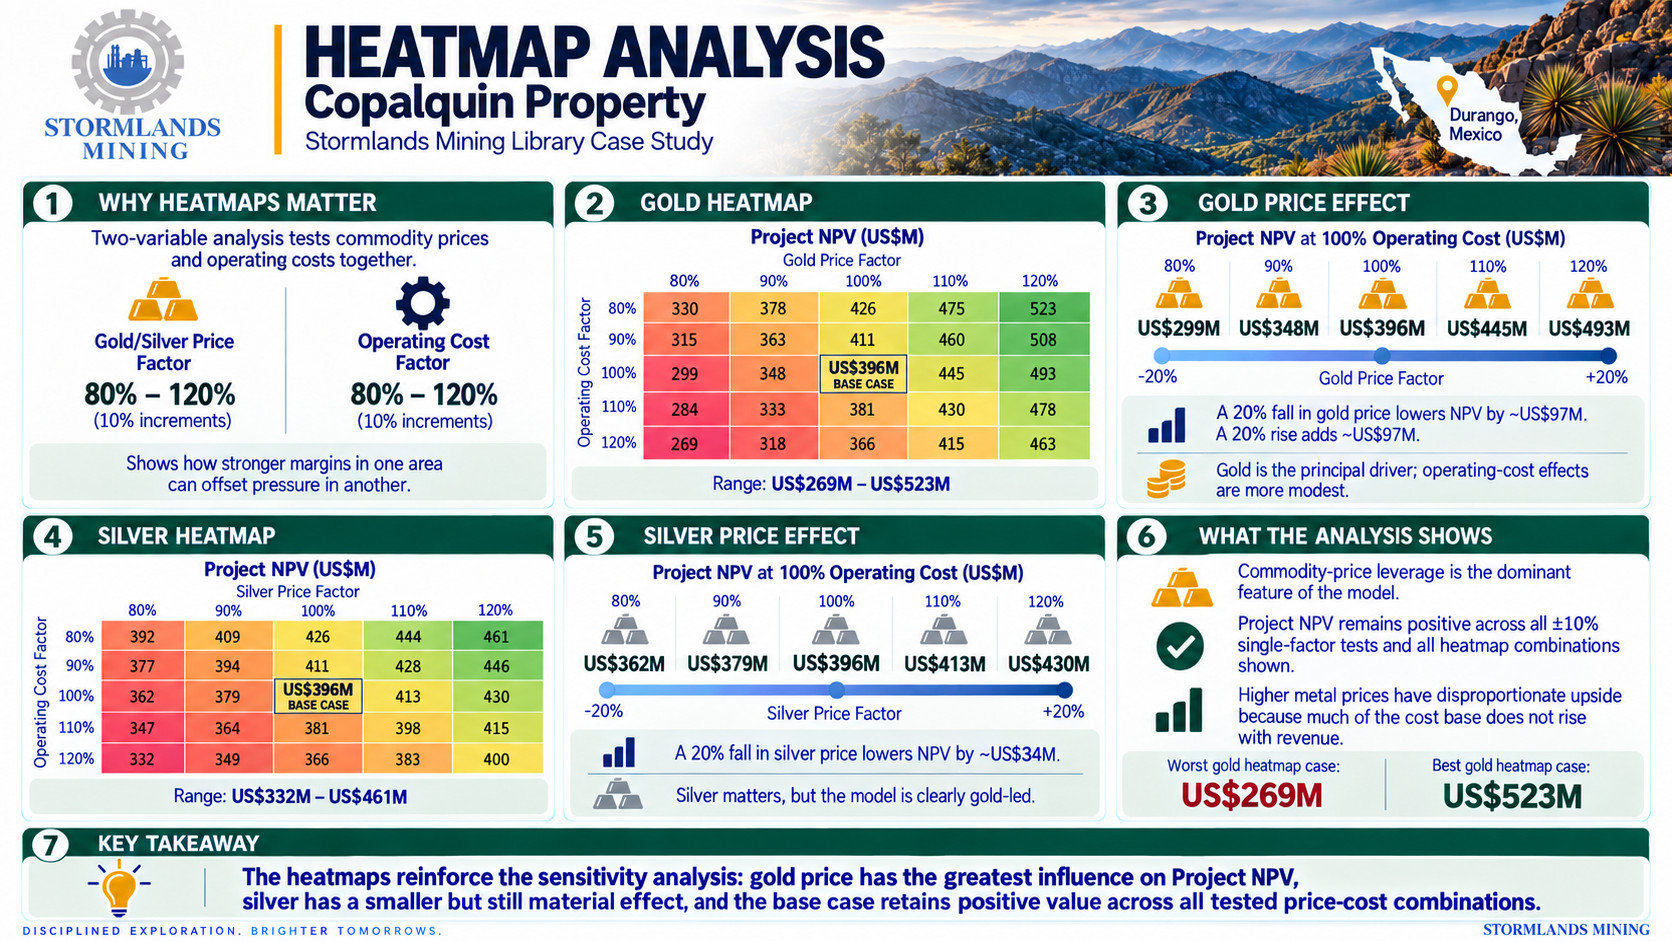
The ±10% sensitivity analysis isolates one variable at a time. Stormlands has therefore also used two-variable heatmaps to examine what happens when commodity prices and operating costs move simultaneously.
For these heatmaps, both the relevant metal price and operating costs are varied from 80% to 120% of the base assumption, in 10% increments.
This broader analysis provides a useful measure of the relationship between commodity-price risk and cost risk and highlights the extent to which stronger margins in one area can offset pressure in another.
Gold Price and Operating Cost
The gold-price heatmap produces the widest range of outcomes.
At 100% of base operating costs, Project NPV changes as follows:
| Gold-price factor | Project NPV |
| 80% | US$299m |
| 90% | US$348m |
| 100% | US$396m |
| 110% | US$445m |
| 120% | US$493m |
A 20% reduction in gold price therefore reduces Project NPV by approximately US$97 million from the base case, even before any change in operating costs.
Conversely, a 20% increase in gold price increases NPV by approximately US$97 million.
Operating-cost movements have a less pronounced effect. At the 100% gold-price assumption, increasing operating costs to 120% reduces NPV to approximately US$366 million, while reducing operating costs to 80% raises it to approximately US$426 million.
The most adverse combination tested is an 80% gold-price factor combined with 120% of base operating costs. Even under that scenario, modelled Project NPV remains approximately US$269 million.
At the opposite extreme, a 120% gold-price factor combined with 80% operating costs produces a Project NPV of approximately US$523 million.
The heatmap therefore reinforces the single-factor sensitivity analysis: gold price is the principal driver, while operating-cost movements have a comparatively more modest effect on project value.
Silver Price and Operating Cost
The silver heatmap follows the same structure but produces a substantially narrower range of outcomes.
At base operating costs, Project NPV varies as follows:
| Silver-price factor | Project NPV |
| 80% | US$362m |
| 90% | US$379m |
| 100% | US$396m |
| 110% | US$413m |
| 120% | US$430m |
A 20% reduction in silver price therefore reduces Project NPV by approximately US$34 million compared with the base case. By contrast, the equivalent 20% reduction in gold price reduces NPV by approximately US$97 million.
At 100% of the silver-price assumption, increasing operating costs to 120% produces an NPV of approximately US$366 million, while reducing costs to 80% increases NPV to approximately US$426 million.
The most adverse combination in the silver heatmap — 80% of the base silver price and 120% operating costs — produces Project NPV of approximately US$332 million.
The strongest combination — 120% silver price and 80% operating costs — produces approximately US$461 million.
The comparison between the two heatmaps makes the project’s commodity exposure particularly clear. Silver provides an important revenue contribution, but the economic model is distinctly gold-led.
What the Sensitivty Anlysis and Heatmaps Tell Us
Taken together, the tornado sensitivity and heatmaps highlight three characteristics of the model.
The first is the scale of commodity-price leverage. Gold and silver prices, particularly gold, have a substantially larger effect on Project NPV than equivalent percentage changes in operating costs, CAPEX or discount rate.
The second is the margin evident in the base case. Across every single-factor ±10% sensitivity and every ±20% commodity-price/operating-cost combination tested in the heatmaps, Project NPV remains positive.
This does not mean that the project is insulated from adverse economic conditions. The analysis tests a defined range around the model assumptions rather than all possible outcomes. It does, however, demonstrate that relatively modest movements in individual assumptions do not eliminate the positive NPV generated by the base model.
The third characteristic is upside leverage. The August 2026 commodity-price scenario demonstrates that higher metal prices can have a disproportionately large impact on project value because much of the modelled cost base does not increase with revenue.
Exploration Potential Beyond the Model
The current Stormlands model intentionally captures only part of the geological opportunity at Copalquin.
The 1.436 Mt Inferred Target 1 resource is excluded entirely, despite containing approximately 103,000 oz of gold and 3.40 million oz of silver.
Potential extensions to the existing El Refugio and La Soledad resources are also excluded.
More importantly, no value is assigned to mineralisation elsewhere within the approximately 7,005-hectare property.
The technical report describes numerous additional mineralised targets and historical workings, including Los Reyes, Los Pinos, Zaragoza, El Gallo, San Manuel, Las Brujas and Apomal, among others. It states that the district can be considered only approximately 30% explored.
Exploration drilling outside the main Target 1 resource has already encountered significant gold-silver mineralisation at several of these locations.
The Qualified Persons recommend further work comprising a 15,500-metre diamond-drilling programme. This includes approximately 2,500 metres of Target 1 conversion drilling, 3,000 metres of Target 1 expansion drilling and 10,000 metres of exploration drilling across additional target areas. Geological studies, environmental work and further metallurgical testing are also recommended.
Importantly, the recommended programme culminates in preparation of a Preliminary Economic Assessment.
That would provide the first formal opportunity to test many of the assumptions currently required in Stormlands’ illustrative model against detailed mine planning, engineering, infrastructure and capital-cost studies.
What the Model Does — and Does Not — Demonstrate
Copalquin is unusual among exploration-stage modelling exercises because the 2026 Mineral Resource has already been constrained using a proposed underground mining method, internal dilution, mining recovery, metallurgical recovery and operating-cost assumptions.
That gives the resource a stronger practical foundation for preliminary economic screening than an unconstrained block-model resource.
It does not, however, amount to a mine plan.
The technical report does not contain a Mineral Reserve, production schedule, detailed capital-cost estimate or economic analysis. Mineral Resources do not have demonstrated economic viability.
Stormlands has therefore had to model several development parameters that would ordinarily be established through a PEA or more advanced engineering study.
The results should consequently be interpreted as an answer to a specific analytical question: what economics could the existing Indicated Target 1 resource imply if it can be developed and operated broadly in accordance with the assumptions used in the Stormlands model?
On that basis, the results are substantial.
What remains to be determined is whether subsequent engineering work can support those assumptions and whether further drilling can enlarge or extend the mineable inventory.
Conclusion
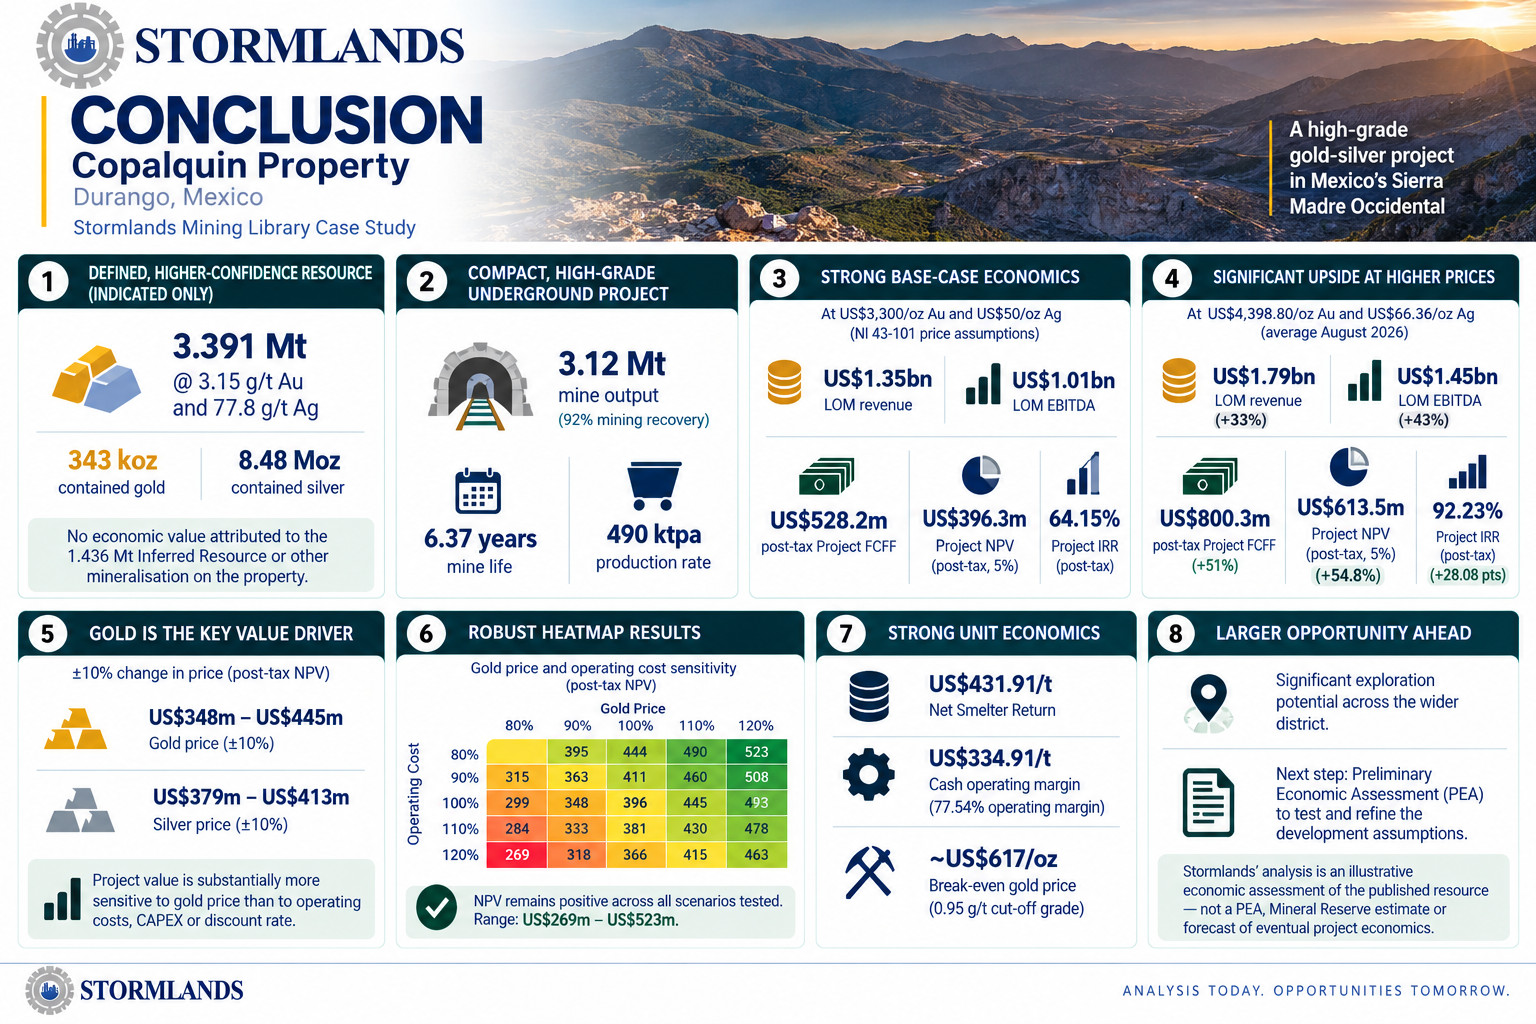
Stormlands’ model of the Copalquin Property shows a relatively compact, high-grade underground gold-silver project with substantial modelled margins and significant leverage to precious-metal prices.
Using only the 3.391 Mt Indicated Target 1 resource, the model applies a 92% mining recovery to generate approximately 3.12 Mt of mine output over a modelled 6.37-year mine life.
At the US$3,300/oz gold and US$50/oz silver prices used in the 2026 technical report’s resource work, the model generates approximately US$1.35 billion in life-of-mine revenue, US$1.01 billion of EBITDA and US$528.2 million of post-tax Project free cash flow.
The resulting Project NPV is US$396.3 million and Project IRR is 64.15%.
The sensitivity analysis shows that project value is most strongly influenced by commodity prices, with gold the dominant individual factor. A ±10% change in gold price changes Project NPV from approximately US$348 million to US$445 million, whereas equivalent percentage changes in operating costs, CAPEX and discount rate have considerably smaller effects.
The heatmaps extend this analysis to ±20% price and operating-cost movements. Even with gold at 80% of the base assumption and operating costs at 120%, Project NPV remains approximately US$269 million in the Stormlands model.
Higher commodity prices generate significant upside. At the August 2026 price scenario of US$4,398.80/oz gold and US$66.36/oz silver, Project NPV increases to US$613.5 million and Project IRR to 92.23%.
Importantly, these economics are generated without including the current Inferred Resource or attributing any value to mineralisation outside the existing Target 1 Indicated inventory.
Copalquin therefore combines a defined, increasingly higher-confidence underground resource with a much larger district-scale exploration opportunity.
The next important step will be the proposed Preliminary Economic Assessment. That work should provide the engineering, mine planning, infrastructure and capital-cost detail required to determine how closely a formal development case aligns with the economics indicated by the Stormlands model.
Until then, Stormlands’ analysis should be viewed as an illustrative economic assessment of the published resource — not a Preliminary Economic Assessment, Mineral Reserve estimate or forecast of eventual project economics.
About Stormlands
Stormlands Mining is an AI-first valuation and analytics platform for mining assets and critical minerals. The platform helps users turn technical disclosures into interactive valuation models in minutes, rather than days or weeks. The valuation models are accessible over multiple platforms to all users, enabling the user to interact directly with the data to facilitate scenario-planning.
The platform enables users to build discounted cash flow models at scale, test commodity price, capex, opex, tax, royalty rates, discount-rates and production scenarios, and compare opportunities and scenarios.
Stormlands is using this technology to build the Stormlands Library: a global repository of mining asset valuation models. It has moved beyond a tool for analysts building individual models and is developing a data layer for the mining industry: a structured source of valuation models and illustrative scenarios. This creates a new way for investors, corporates, professional advisers, financial-market users and public-policy stakeholders to screen assets, benchmark projects and understand the key drivers of mining asset economics.
If you are interested in accessing the models in the library, email ceo@stormlandsmining.com
Important Notice
This analysis has been prepared by Stormlands Mining using publicly available information from the NI 43-101 Technical Report together with Stormlands’ own independent modelling assumptions.
The analysis is illustrative only. It is not a Preliminary Economic Assessment, Pre-Feasibility Study, Feasibility Study, Mineral Reserve estimate or independent technical report. It has not been prepared on behalf of the project owner and has not been reviewed or approved by the project owner.
The model outputs are Stormlands-generated illustrative estimates only. They should not be interpreted as demonstrated economic viability. Future technical work, including mine planning, metallurgical testing, engineering, environmental studies, permitting, capital-cost estimation and operating-cost estimation, would be required before any formal economic conclusions could be drawn.