
Northumberland Gold
Based on the The 2026 NI 43-101 Technical Report, effective July 31, 2026 and independent modelling by Stormlands Mining
Northumberland Gold Project, Nevada, USA
Introduction
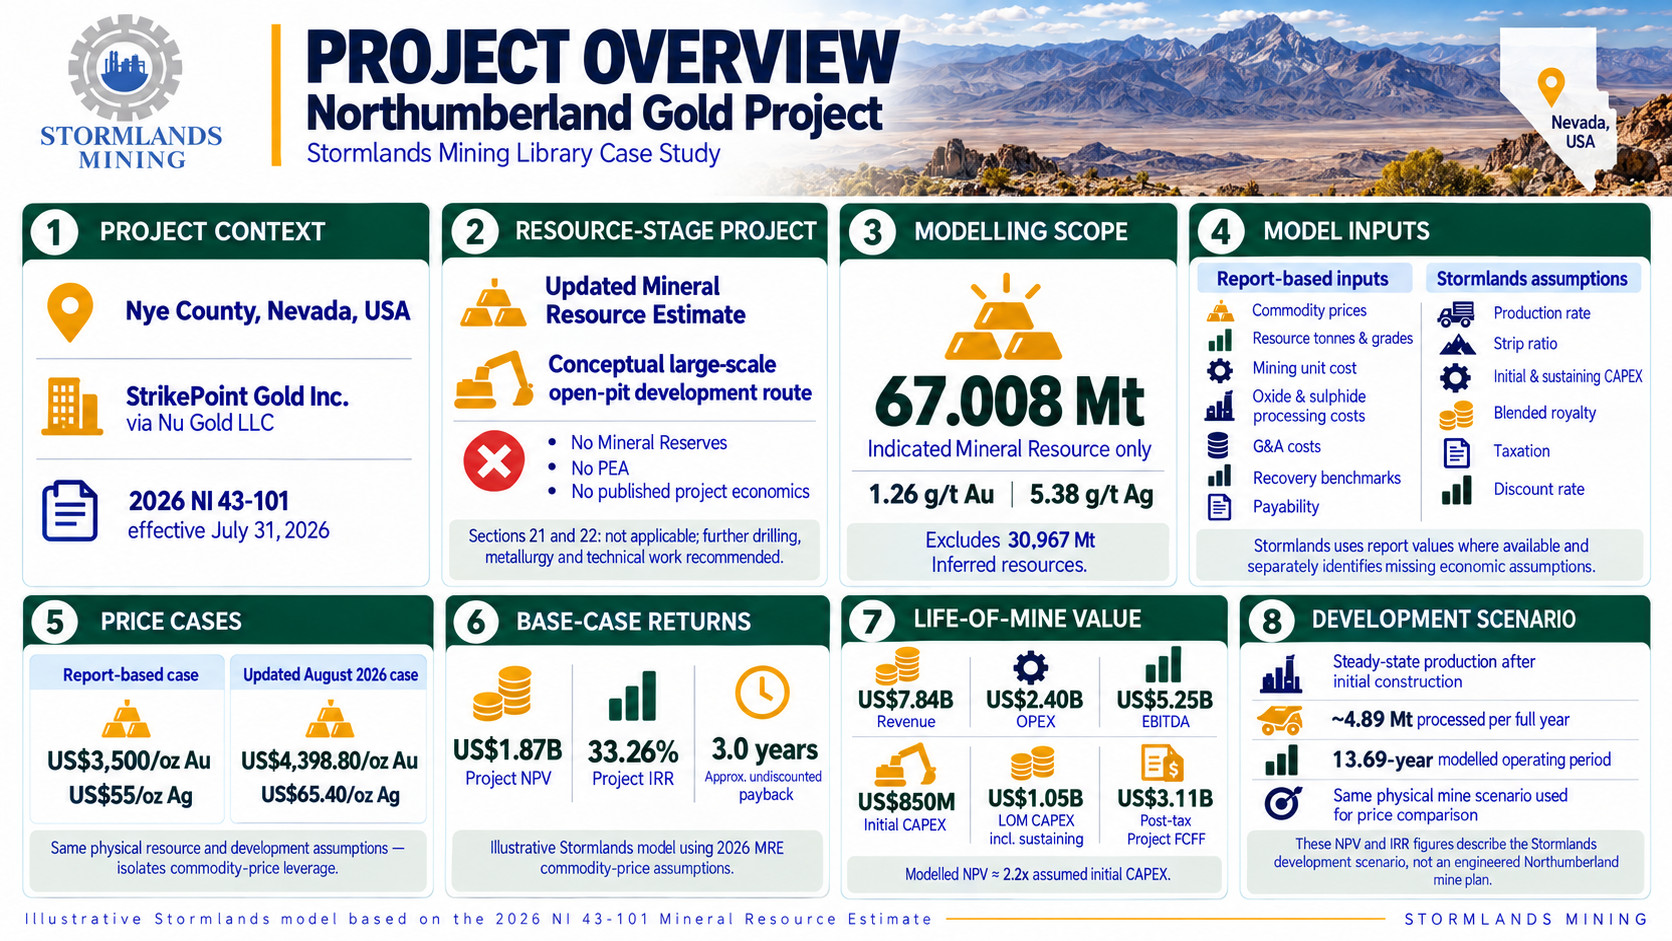
Stormlands Mining has developed an illustrative economic model for the Northumberland Gold Project in Nye County, Nevada, USA. The analysis demonstrates how a Mineral Resource Estimate can be converted into a structured project-level valuation framework before a formal economic study has been completed.
Northumberland is a gold-silver project owned by StrikePoint Gold Inc. through its subsidiary Nu Gold LLC. The 2026 NI 43-101 Technical Report, effective July 31, 2026, reports an updated Mineral Resource Estimate and describes a conceptual large-scale open-pit development route. However, the report does not contain Mineral Reserves, a Preliminary Economic Assessment or published project economics. Sections 21 and 22, covering capital and operating costs and economic analysis respectively, are stated as not applicable. The report instead recommends additional drilling, metallurgical work and technical studies required to advance the Project toward a PEA.
Stormlands has therefore created an illustrative economic model using only the 67.008 million-tonne Indicated Mineral Resource, grading 1.26 g/t gold and 5.38 g/t silver. The additional 30.967 Mt of Inferred Mineral Resources are excluded from the production model.
Where the technical report provides parameters that can be applied directly to the model, Stormlands uses those values or derives blended assumptions from them. These include commodity prices, resource tonnage and grades, mining unit cost, oxide and sulphide processing costs, G&A costs, metallurgical-recovery benchmarks and payability. Where essential economic inputs are absent – including production rate, strip ratio, initial and sustaining capital, blended royalty, taxation and discount rate – Stormlands uses separately identified modelling assumptions.
The report-based scenario uses the US$3,500/oz gold and US$55/oz silver prices applied in the 2026 Mineral Resource Estimate. A second model keeps the same physical resource, production rate, recoveries, CAPEX, OPEX and other development assumptions but updates commodity prices to the Stormlands August 2026 averages of US$4,398.80/oz gold and US$65.40/oz silver.
The comparison therefore isolates commodity-price leverage within the same illustrative development case. It does not assume additional tonnes, higher grades, improved recoveries, lower costs or a re-optimized mine plan.
Project Context
Mineral Resource Estimate
The 2026 NI 43-101 reports the following Mineral Resources:
| Mineral Resource | Tonnage | Gold grade | Silver grade | Contained gold | Contained silver |
| Indicated | 67.008 Mt | 1.26 g/t Au | 5.38 g/t Ag | 2.709 Moz | 11.599 Moz |
| Inferred | 30.967 Mt | 1.53 g/t Au | 4.28 g/t Ag | 1.519 Moz | 4.260 Moz |
The Stormlands economic model uses only the Indicated category. The Inferred Mineral Resource is excluded from the illustrative production inventory and assigned no economic value.
An important feature of Northumberland is the distribution of the Indicated resource between oxide and sulphide material:
| Indicated Resource | Tonnage | Gold grade | Silver grade | Contained gold | Contained silver |
| Oxide | 19.068 Mt | 0.79 g/t | 5.99 g/t | 0.483 Moz | 3.670 Moz |
| Sulphide | 47.940 Mt | 1.44 g/t | 5.14 g/t | 2.227 Moz | 7.929 Moz |
| Total | 67.008 Mt | 1.26 g/t | 5.38 g/t | 2.709 Moz | 11.599 Moz |
Sulphide material represents approximately 71.5% of Indicated tonnes but 82.2% of contained gold. Approximately 68% of contained silver is also in sulphide material.
This distinction is fundamental to the economics. Northumberland is not simply an oxide gold project with a later refractory extension: the majority of the resource and the great majority of the contained gold sit within sulphide mineralization.
Metallurgical Context
The technical report proposes different conceptual recovery assumptions depending on oxidation state and preg-robbing characteristics.
Oxide material is assigned 75% recovery for both gold and silver. Sulphide recoveries range from 90% gold and 70% silver for low preg-robbing material to 60% gold and 40% silver for high preg-robbing material. The medium preg-robbing benchmark is 80% gold and 60% silver.
For the Stormlands model, the sulphide resource is modelled at the medium preg-robbing benchmark. Combining this with the oxide resource generates blended recoveries of approximately:
| Metal | Blended recovery |
| Gold | 78.6% |
| Silver | 64.3% |
These are therefore report-based recoveries incorporating a Stormlands assumption that the sulphide resource behaves, on average, in line with the medium preg-robbing case.
This is an important qualification. The technical report identifies metallurgical variability as a major area requiring further work. Existing test samples cannot always be linked reliably to the present block model, and preg-robbing values have limited spatial coverage. Further geometallurgical sampling, test work and investigation of alternative process routes are specifically recommended.
Model Basis
Physical and Production Assumptions
| Assumption | Stormlands Model | Basis |
| Indicated Mineral Resource used | 67.008 Mt | NI 43-101 |
| Gold grade | 1.26 g/t | NI 43-101 |
| Silver grade | 5.38 g/t | NI 43-101 |
| Oxide tonnage | 19.068 Mt | NI 43-101 |
| Sulphide tonnage | 47.940 Mt | NI 43-101 |
| Gold recovery | 78.6% | Report-based blended assumption |
| Silver recovery | 64.3% | Report-based blended assumption |
| Mine recovery | 100% | Stormlands assumption |
| Mining dilution | 0% | Stormlands assumption |
| Daily production rate | 13,406 tpd | Taylor’s Rule |
| Annual production rate | 4.893 Mtpa | Derived |
| Modelled operating period | 13.69 years | Derived |
| Strip ratio | 3.5:1 waste:ore | Benchmark assumption |
The 13,406 tpd production rate is not published in the NI 43-101. Stormlands derives the rate using Taylor’s Rule applied to the selected 67.008 Mt Indicated resource. The resulting 4.893 Mtpa throughput produces a modelled operating period of approximately 13.69 years.
This should not be interpreted as a mine schedule proposed by StrikePoint or SLR. It is a modelling assumption used to translate the resource into annual production and cash flow.
Economic Assumptions
| Assumption | Report-Based Case | Updated Commodity-Price Case |
| Gold price | US$3,500/oz | US$4,398.80/oz |
| Silver price | US$55/oz | US$65.40/oz |
| Initial CAPEX | US$850m | US$850m |
| LOM CAPEX incl. sustaining | US$1.048bn | US$1.048bn |
| Modelled OPEX | US$35.76/t | US$35.76/t |
| Commercial royalty | 2.5% | 2.5% |
| Corporate tax assumption | 26% | 26% |
| Discount rate | 5% | 5% |
The NI 43-101 provides mining costs of US$2.12/t total material moved, processing costs of US$12/t for oxide and US$30/t for sulphide, and G&A costs of US$1.35/t milled. Applying the resource mix and Stormlands’ 3.5:1 strip-ratio assumption produces the modelled US$35.76/t site operating cost.
The US$850 million initial CAPEX, US$3/t sustaining-capital assumption, 3.5:1 strip ratio, 2.5% blended commercial royalty, 26% tax rate and 5% discount rate are independently estimated Stormlands assumptions rather than values established by project-level engineering.
Key Highlights
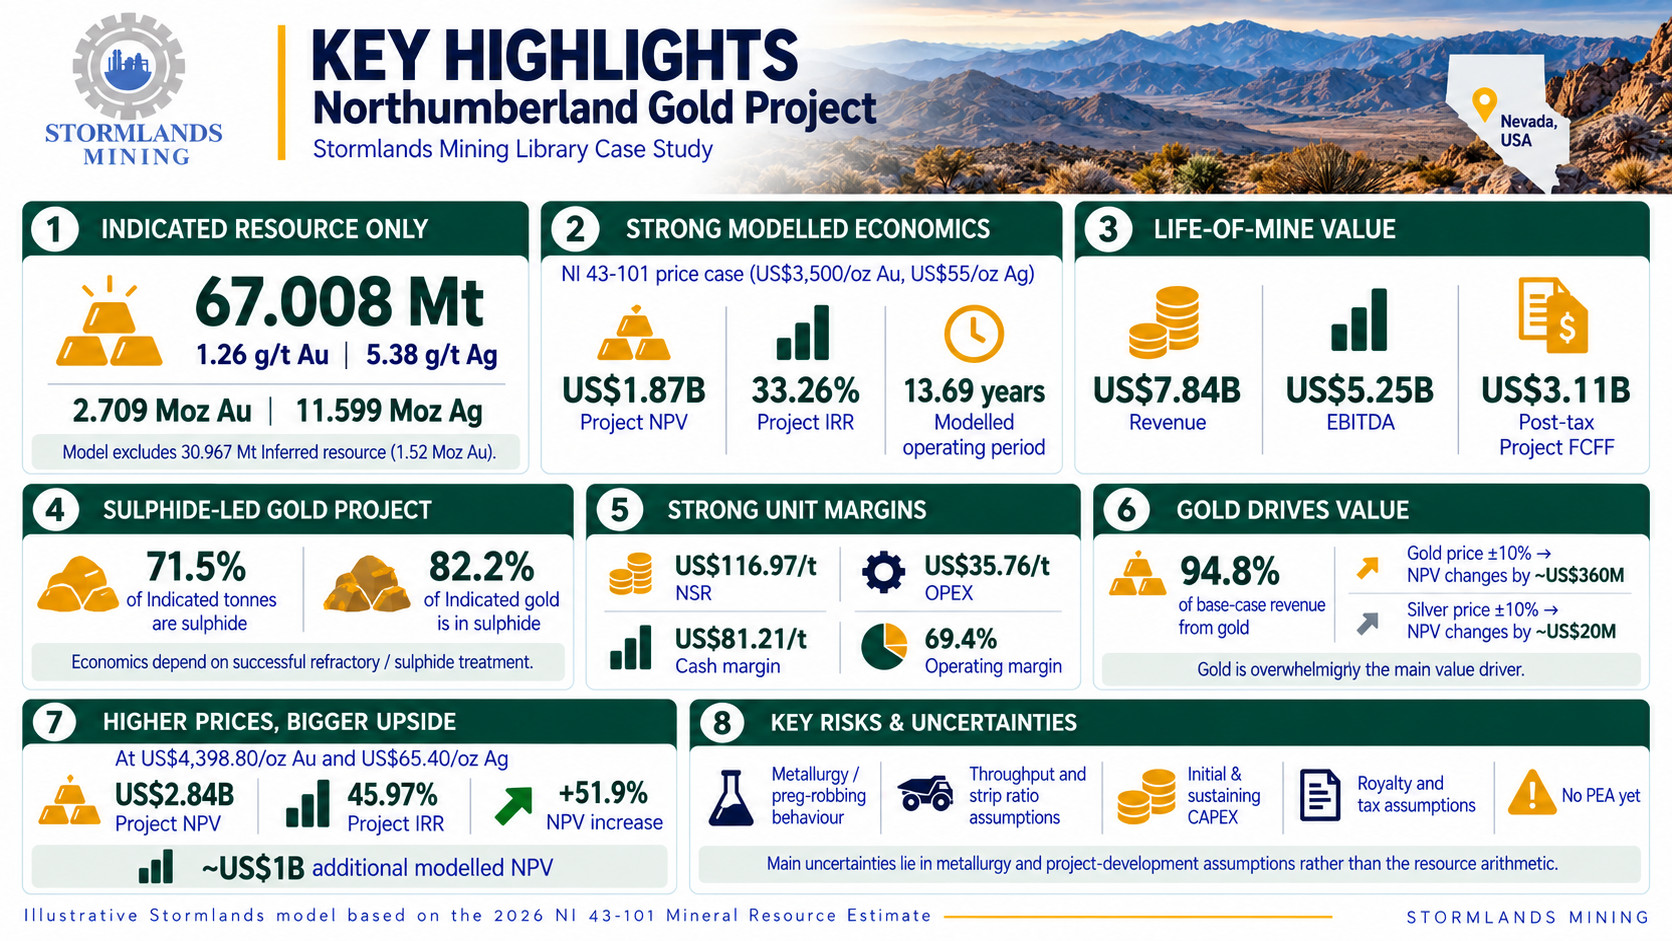
- Stormlands’ report-based model produces a post-tax Project NPV of approximately US$1.87 billion and a Project IRR of 33.26%. The model generates approximately US$7.84 billion of life-of-mine revenue, US$5.25 billion of EBITDA and US$3.11 billion of post-tax Project free cash flow. These are Stormlands-generated illustrative outputs, not economics published in the NI 43-101.
- Northumberland is fundamentally a sulphide gold project. Sulphide material represents approximately 71.5% of the Indicated resource but contains about 82.2% of its gold. The economic outcome is therefore closely linked to successful treatment of refractory sulphide material rather than oxide processing alone.
- The model produces substantial unit margins at the NI 43-101 resource prices. Net Smelter Return is approximately US$116.97/t against modelled OPEX of US$35.76/t, generating a cash operating margin of approximately US$81.21/t and an operating-margin percentage of 69.4%.
- Gold overwhelmingly drives the economics. Approximately US$7.43 billion, or 94.8%, of base-case LOM revenue is attributable to gold, compared with approximately US$408 million from silver. A +/-10% gold-price movement changes NPV by roughly US$360 million, whereas an equivalent silver-price movement changes NPV by only around US$20 million.
- The model deliberately excludes 30.967 Mt of Inferred Mineral Resources containing approximately 1.52 Moz of gold. This material is not included in mine life, revenue or NPV. Successful future conversion could expand the economic inventory, but no such conversion is assumed by Stormlands.
- Updating commodity prices to average of August 2026 prices for gold and silver creates almost US$1 billion of additional modelled NPV without changing the mine scenario. At US$4,398.80/oz gold and US$65.40/oz silver, NPV increases by approximately 51.9% to US$2.84 billion, while IRR rises to 45.97%.
- The higher-price scenario demonstrates strong operating leverage. Revenue rises by 25.3%, but EBITDA increases by 36.9%, post-tax FCFF by 46.1% and NPV by 51.9%, because the same resource and cost structure are retained while commodity prices increase.
- The principal uncertainties lie in metallurgy and project-development assumptions rather than the resource arithmetic. Throughput, strip ratio, initial capital, sustaining capital, royalty and taxation are not established through a PEA, while sulphide recovery depends on geometallurgical characteristics that the technical report recommends investigating further.
Base-case model
Project NPV and Returns
Using the commodity-price data from the 2026 Mineral Resource Estimate, Stormlands’ model produces the following illustrative economic outputs:
| Metric | Report-Based Case |
| Gold price | US$3,500/oz |
| Silver price | US$55/oz |
| LOM revenue | US$7.84bn |
| LOM OPEX | US$2.40bn |
| LOM EBITDA | US$5.25bn |
| Initial CAPEX | US$850m |
| LOM CAPEX incl. sustaining | US$1.05bn |
| Post-tax Project FCFF | US$3.11bn |
| Project NPV | US$1.87bn |
| Project IRR | 33.26% |
| Approx. undiscounted payback | 3.0 years |
The modelled NPV is approximately 2.2 times the assumed initial development CAPEX.
The cash-flow profile is relatively straightforward because Stormlands assumes steady-state production after initial construction rather than building a detailed annual mine sequence. Approximately 4.89 Mt is processed in each full operating year, with a partial final year.
The resulting NPV and IRR therefore describe the economics of the Stormlands development scenario, rather than the economics of an engineered Northumberland mine plan.
Revenue Mix: Northumberland is Economically Gold-Led
In the report-based case, Stormlands models:
| Revenue | LOM Revenue | Share |
| Gold | US$7.43bn | 94.8% |
| Silver | US$407.8m | 5.2% |
| Total | US$7.84bn | 100% |
The project contains significant silver – approximately 11.6 Moz in the Indicated Mineral Resource – but silver remains a secondary economic contributor at the modelled grades and prices.
This has an important implication for project risk. Northumberland’s valuation is much more exposed to changes in the gold price than to changes in silver price. Silver adds useful by-product value, but the economic case does not rely heavily on higher silver prices.
Contained, Recovered and Payable Metal
Stormlands progressively applies metallurgical recovery and payability to the resource inventory:
| Metal | Modelled contained metal | Recovered metal | Payable metal |
| Gold | 2.714 Moz | 2.134 Moz | 2.123 Moz |
| Silver | 11.590 Moz | 7.453 Moz | 7.415 Moz |
The small difference between the modelled 2.714 Moz of contained gold and the 2.709 Moz reported in the NI 43-101 is a rounding effect. Stormlands calculates contained metal from the published rounded resource tonnage and grade, whereas the NI 43-101 contained-ounce figure is derived from the underlying block model.
The more economically important transition occurs between contained and recovered metal. Approximately 580,000 modelled contained gold ounces are not recovered, reflecting the blended 78.6% gold-recovery assumption.
This makes recovery performance a significant value driver, particularly because most of the contained gold is hosted in sulphide mineralization.
Unit Economics and Operating Margin
The base model produces the following unit economics:
| Unit Metric | Base Case |
| Net Smelter Return | US$116.97/t |
| Mining cost | US$9.54/t ore |
| Processing cost | US$24.87/t ore |
| G&A | US$1.35/t |
| Total OPEX | US$35.76/t |
| Cash operating margin | US$81.21/t |
| Operating margin | 69.43% |
The weighted processing cost reflects a much higher assumed cost for sulphide material: US$30/t compared with US$12/t for oxide material.
The US$9.54/t mining component requires additional qualification. The technical report publishes mining cost at US$2.12/t of total material moved; the Stormlands model converts this to a cost per tonne of ore using its independently assumed 3.5:1 waste-to-ore strip ratio.
At the modelled throughput, annual site OPEX is approximately US$175 million. Over the full production period, LOM OPEX totals approximately US$2.40 billion.
The resulting US$81/t base-case cash margin gives the model significant apparent economic headroom, but part of that headroom depends on development assumptions – particularly strip ratio and metallurgical performance – that remain to be demonstrated through mine planning and technical studies.
Production Rate and Modelled Operating Period
The 2026 NI 43-101 does not define an annual processing rate or mine schedule.
Stormlands therefore applies Taylor’s Rule to the 67.008 Mt Indicated resource, generating:
| Production Assumption | Stormlands Model |
| Daily production | 13,406 tpd |
| Annual production | 4.893 Mtpa |
| Modelled operating period | 13.69 years |
The 13.69-year figure should consequently be understood as a modelled operating period at the assumed throughput, not as a demonstrated mine life.
Future pit optimization, mine sequencing, geotechnical design and process-capacity studies could produce a materially different production profile.
Capital Cost
Stormlands assumes US$850 million of initial development CAPEX, benchmarked against comparable large-scale refractory gold developments. Including sustaining capital, total modelled LOM CAPEX is approximately US$1.05 billion.
Commercial Royalty
The model applies a 2.5% blended commercial royalty.
The technical report describes different claim-specific royalty burdens ranging from approximately 1% to 4% and does not publish a single weighted royalty applicable to the modelled pit inventory. Stormlands therefore uses a benchmark midpoint for the economic model.
Inferred Resources are Excluded from the Model
Northumberland also contains 30.967 Mt of Inferred Mineral Resources grading 1.53 g/t gold and 4.28 g/t silver, containing approximately 1.519 Moz gold and 4.260 Moz silver.
This resource is entirely excluded from the Stormlands economic model.
Updated Commodity Price Scenario
leaving the entire physical development case unchanged.
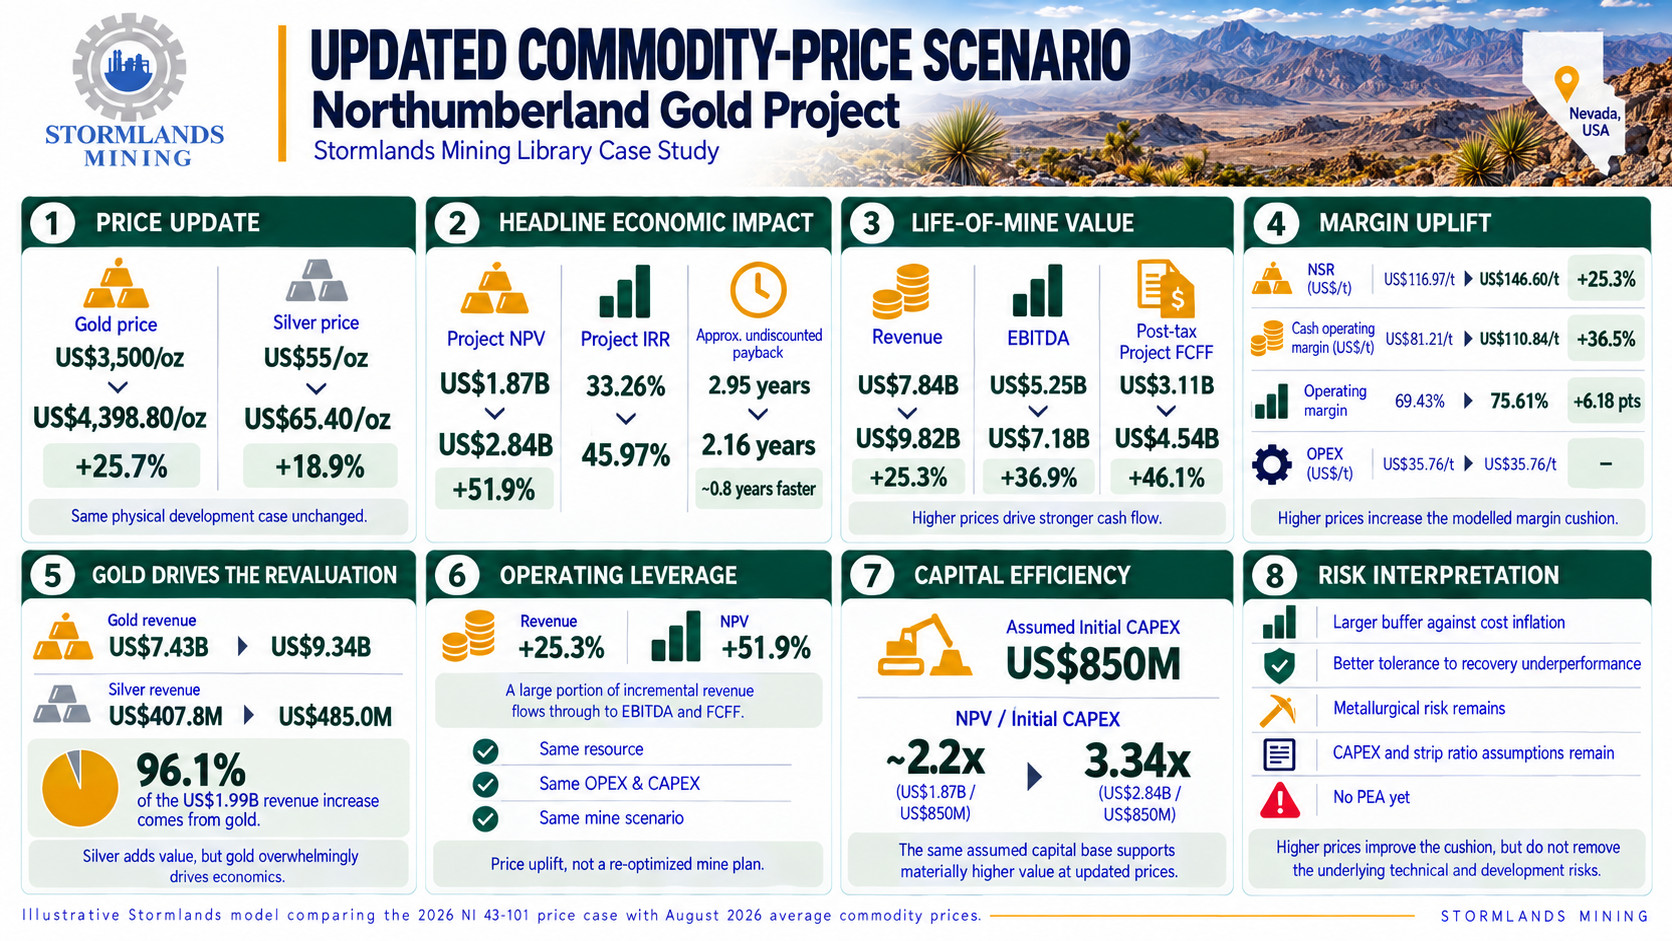
Gold increases from US$3,500/oz to US$4,398.80/oz, a 25.7% increase. Silver increases from US$55/oz to US$65.40/oz, an 18.9% increase.
Impact on Project Economics
| Metric | Report-Based Case | Updated Case | Change |
| Gold price | US$3,500/oz | US$4,398.80/oz | +25.7% |
| Silver price | US$55/oz | US$65.40/oz | +18.9% |
| LOM revenue | US$7.84bn | US$9.82bn | +25.3% |
| LOM EBITDA | US$5.25bn | US$7.18bn | +36.9% |
| Post-tax Project FCFF | US$3.11bn | US$4.54bn | +46.1% |
| Project NPV | US$1.87bn | US$2.84bn | +51.9% |
| Project IRR | 33.26% | 45.97% | +12.71 points |
| Approx. undiscounted payback | 2.95 years | 2.16 years | ~0.8 years faster |
| NSR | US$116.97/t | US$146.60/t | +25.3% |
| Cash operating margin | US$81.21/t | US$110.84/t | +36.5% |
| Operating margin | 69.43% | 75.61% | +6.18 points |
The updated commodity-price case adds approximately US$1.99 billion of LOM revenue, but approximately US$971 million of additional NPV.
Revenue therefore increases by 25.3%, while NPV increases by almost 52%.
This reflects substantial operating leverage. The physical project, operating costs and capital requirements remain unchanged, meaning a large portion of incremental revenue flows through to EBITDA and free cash flow.
At the updated prices, NPV rises from approximately 2.2x to 3.34x the assumed US$850 million initial CAPEX.
Gold Accounts for Almost All of the Revaluation
Gold revenue increases from approximately US$7.43bn to US$9.34bn, while silver revenue increases from US$407.8m to US$485.0m.
Approximately 96.1% of the US$1.99 billion increase in LOM revenue is attributable to gold.
This reinforces the conclusion from the base model: Northumberland’s economic exposure is overwhelmingly to gold. Silver improves project value, but movements in silver price have relatively limited influence on overall valuation.
Higher Prices Increase the Modelled Margin Cushion
Because OPEX remains unchanged at US$35.76/t, Net Smelter Return rises by approximately US$29.63/t.
The full increase flows through to the operating margin before changes in royalties and taxation:
| Cash operating margin | |
| Base case | US$81.21/t |
| Updated-price case | US$110.84/t |
This increases the operating-margin percentage from approximately 69.4% to 75.6%.
Higher commodity prices therefore provide a larger modelled buffer against cost inflation, recovery underperformance or other project-level challenges. They do not, however, remove those risks.
Stormlands Sensitivity Analysis
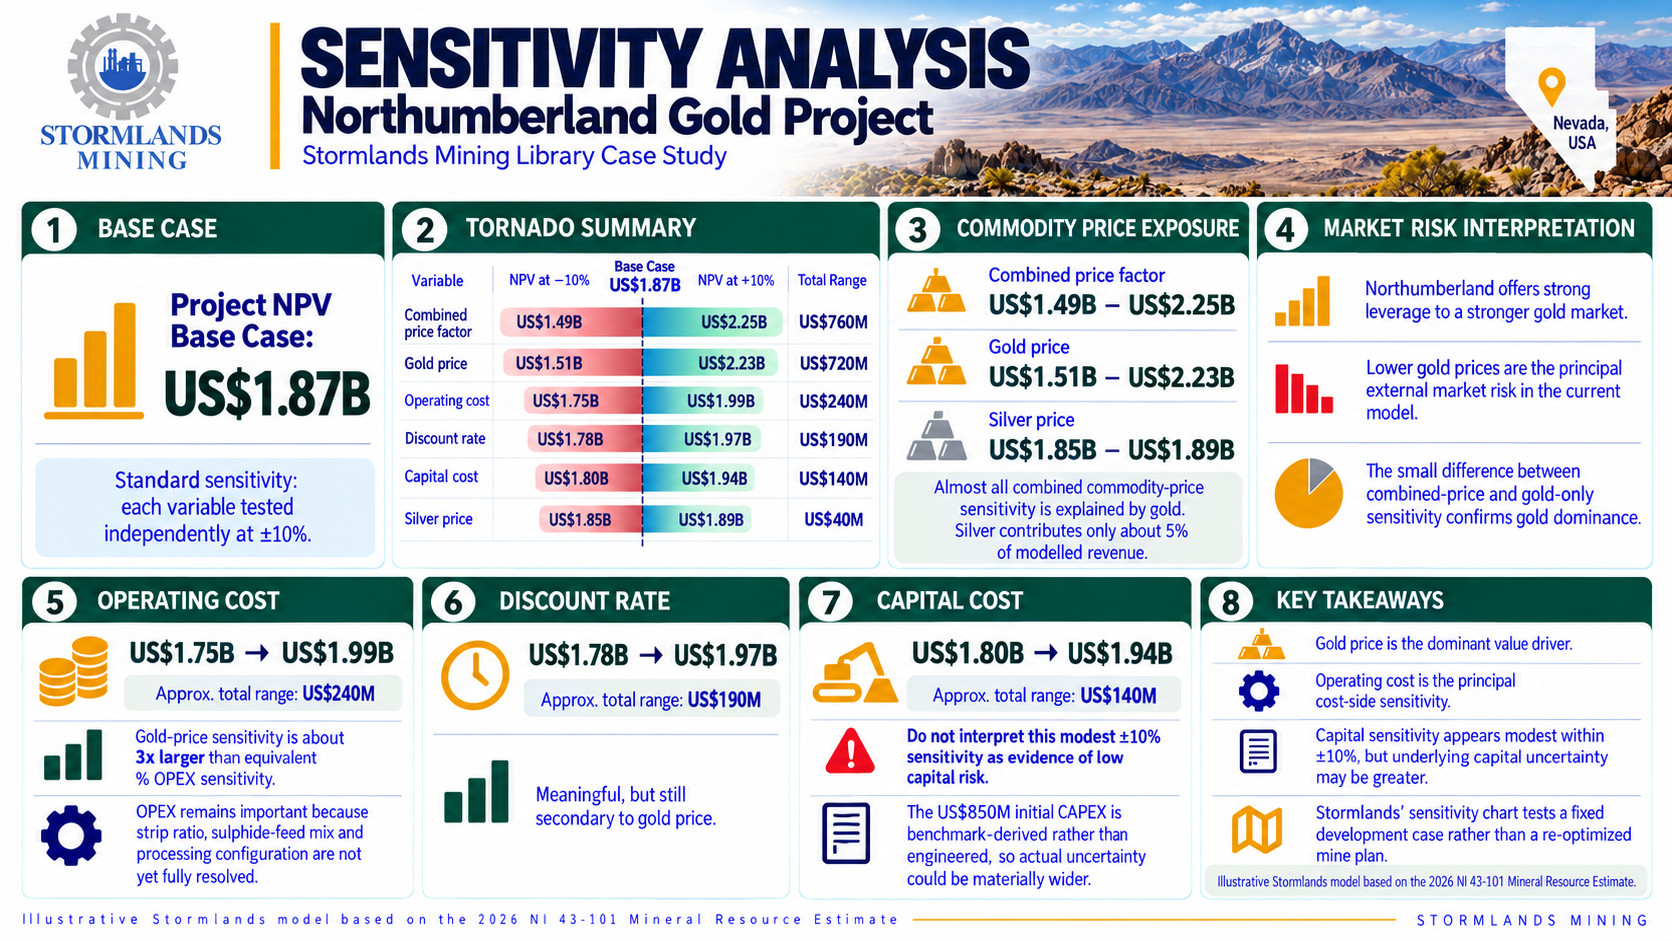
The standard sensitivity analysis independently varies each selected factor by +/-10% around the report-based NPV of approximately US$1.87 billion.
| Variable | Lower NPV | Higher NPV | Approx. total range |
| Combined price factor | US$1.49bn | US$2.25bn | US$760m |
| Gold price | US$1.51bn | US$2.23bn | US$720m |
| Operating cost | US$1.75bn | US$1.99bn | US$240m |
| Discount rate | US$1.78bn | US$1.97bn | US$190m |
| Capital cost | US$1.80bn | US$1.94bn | US$140m |
| Silver price | US$1.85bn | US$1.89bn | US$40m |
Gold Price is the Dominant Market Risk
A +/-10% change in gold price moves NPV by approximately US$360 million in either direction.
Almost the entire combined commodity-price sensitivity can be explained by gold. The difference between the combined price-factor range and the gold-only range is small, consistent with silver contributing only about 5% of modelled revenue.
For investors or project developers, this means that Northumberland provides substantial leverage to a stronger gold market – but also that lower gold prices represent the principal external market risk in the current model.
Operating Cost is the Principal Cost-Side Sensitivity
A +/-10% change in modelled OPEX produces NPVs of approximately US$1.75 billion to US$1.99 billion.
The NPV response to gold price is therefore about three times larger than the response to an equivalent percentage movement in operating cost.
Operating cost nevertheless remains particularly relevant because several components of it are dependent upon unresolved project assumptions, including strip ratio, the proportion of sulphide feed and the eventual processing configuration.
Capital Sensitivity Appears Modest – but the Underlying Estimate is Uncertain
Changing CAPEX by +/-10% moves NPV to approximately US$1.80 billion to US$1.94 billion.
Within that narrow test range, capital has less influence on NPV than operating costs or gold price.
However, this should not be interpreted as evidence that capital cost is low risk. The underlying US$850 million estimate is itself benchmark-derived rather than engineered. The standard +/-10% sensitivity may therefore understate the uncertainty associated with the actual development cost of a Northumberland POX-based project.
Heatmap Analysis
Gold Price and Operating Cost
The gold/OPEX heatmap simultaneously varies gold price and operating cost from 80% to 120% of the base assumptions.
Across all 25 tested combinations, NPV remains positive.
The lowest NPV occurs at 80% gold price / 120% OPEX: approximately US$903 million, while the highest occurs at 120% gold price / 80% OPEX: approximately US$2.84 billion.
At base operating cost, reducing gold price by 20% decreases NPV from approximately US$1.87 billion to US$1.14 billion. Increasing gold price by 20% raises it to approximately US$2.60 billion.
At the base gold price, increasing OPEX by 20% reduces NPV to approximately US$1.63 billion, while reducing OPEX by 20% increases it to approximately US$2.11 billion.
The downside corner corresponds approximately to US$2,800/oz gold and US$42.91/t OPEX. The model therefore shows considerable NPV headroom across the specific range tested.
This is meaningful evidence of robustness within the fixed Stormlands development scenario, but it is not equivalent to demonstrating economic viability under an engineered mine plan.
The heatmap does not recalculate pit limits, cut-off grades, mine sequencing, resource classification or production capacity as prices or costs change.
Silver Price and Operating Cost
The silver/OPEX heatmap confirms how limited Northumberland’s economic exposure is to silver price.
At base OPEX, changing silver from 80% to 120% of the base price moves NPV only from approximately US$1.83 billion to US$1.91 billion.
By comparison, with silver held at its base price, changing OPEX from 120% to 80% moves NPV from approximately US$1.63 billion to US$2.11 billion.
Across the full silver/OPEX matrix, NPV ranges from approximately US$1.59 billion to US$2.15 billion.
Operating-cost control is therefore substantially more important to Northumberland’s modelled value than movements in silver price.
Updated prices and project risk
Updated Prices and Project Risk
The updated commodity-price scenario improves all of the headline financial outputs, but it does not change the underlying technical maturity of the Project.
The same 67.008 Mt resource is processed at the same rate. Recoveries are unchanged. The same US$850 million initial capital, 3.5:1 strip ratio, US$35.76/t operating cost and 2.5% commercial royalty remain in the model.
This distinction produces several important risk insights.
Commodity-price strength creates a larger financial cushion
At August 2026 average prices, the cash operating margin increases by approximately US$30/t and NPV rises by almost US$1 billion. A stronger price environment can therefore absorb materially more operating-cost inflation or technical underperformance before the modelled economic case is eroded.
The gold/OPEX heatmap reinforces this point: even a simultaneous 20% reduction in gold price from the NI 43-101 price and 20% increase in operating cost leaves approximately US$903 million of NPV in the fixed Stormlands model.
Price leverage also means price concentration risk
The same feature that creates upside also creates exposure.
About 95% of base revenue comes from gold, and approximately 96% of the incremental revenue in the updated scenario is caused by the higher gold price.
Northumberland consequently has very strong leverage to a rising gold market, but there is limited commodity diversification within the model. Silver cannot compensate for a major deterioration in gold price.
Higher prices do not de-risk metallurgy
Metallurgical recovery is unchanged between the two models.
This is important because recovery is not included in the standard tornado sensitivity despite the technical report identifying sulphide behaviour and preg-robbing as material uncertainties.
Given that approximately 82% of Indicated gold is in sulphide material, future recovery test work could have a material impact on revenue and project value independently of commodity prices.
In this respect, the higher-price case improves the project’s financial tolerance to metallurgical risk, but it does not reduce the underlying technical uncertainty.
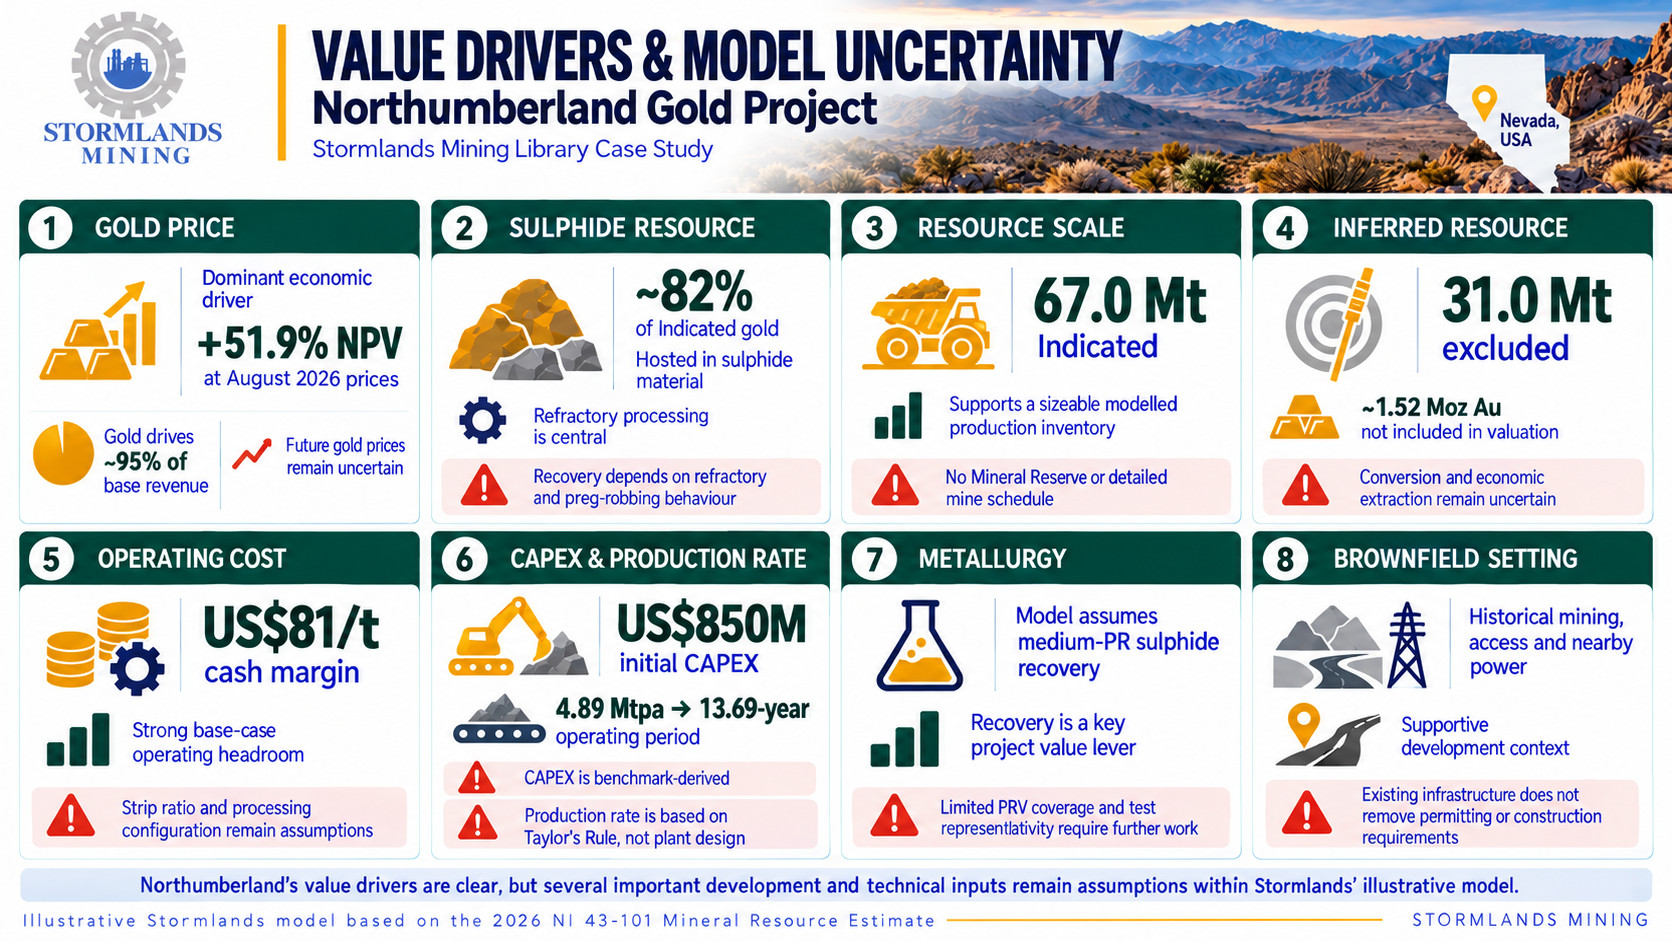
Value Drivers and Model Uncertainty
| Value Driver | Stormlands Observation | Principal Qualification |
| Gold price | Dominant economic driver; August pricing increases NPV by 51.9% | Future gold prices remain uncertain |
| Sulphide resource | Contains ~82% of Indicated gold | Recovery depends on refractory and preg-robbing characteristics |
| Resource scale | 67.0 Mt Indicated supports a sizeable modelled production inventory | No Mineral Reserve or detailed mine schedule |
| Inferred resource | Additional 31.0 Mt / 1.52 Moz Au excluded from valuation | Conversion and eventual economic extraction are uncertain |
| Operating cost | Base model generates US$81/t cash margin | Strip ratio and processing configuration remain assumptions |
| CAPEX | US$850m benchmark supports strong modelled returns | Not based on Northumberland-specific engineering |
| Production rate | 4.89 Mtpa results in a 13.69-year operating period | Taylor’s Rule assumption, not plant or mine design |
| Metallurgy | Model assumes medium-PR sulphide recovery | Limited PRV coverage and test representativity require further work |
| Brownfield setting | Historical mining, access and nearby power offer development context | Existing infrastructure does not remove permitting or construction requirements |
The central distinction is between a relatively well-defined Mineral Resource and a much less-defined development scenario.
The resource tonnes, grades, classification, material types and several RPEEE cost and recovery assumptions come directly from the NI 43-101. The production rate, strip ratio, capital cost, royalty and financial assumptions required to transform those resource data into a project valuation are generated independently by Stormlands.
That separation is fundamental to interpreting the outputs correctly.
Conclusion
Stormlands’ illustrative model of the Northumberland Gold Project shows a large, gold-dominant resource with substantial modelled margins and significant leverage to gold price.
Using only the 67.008 Mt Indicated Mineral Resource grading 1.26 g/t gold and 5.38 g/t silver, together with the US$3,500/oz gold and US$55/oz silver prices used in the 2026 technical report’s Mineral Resource assumptions, the Stormlands model generates approximately US$7.84 billion of LOM revenue, US$5.25 billion of EBITDA and US$3.11 billion of post-tax Project free cash flow.
The resulting post-tax Project NPV is approximately US$1.87 billion, with a Project IRR of 33.26%.
The underlying resource is predominantly sulphide. Approximately 71.5% of Indicated tonnes and 82.2% of contained gold occur in sulphide material. The project’s economic outcome is therefore closely linked to successful refractory processing and the ability to achieve the recovery assumptions used in the model.
At base prices, the model produces Net Smelter Return of approximately US$116.97/t against US$35.76/t of OPEX, leaving a cash operating margin of approximately US$81.21/t and a margin percentage of approximately 69.4%.
Gold is the dominant economic driver, contributing approximately 94.8% of base-case revenue. This is confirmed by the sensitivity analysis: a +/-10% movement in gold price moves NPV by roughly US$360 million, while an equivalent movement in silver price changes NPV by only around US$20 million.
Re-running the model at Stormlands’ August 2026 average commodity prices of US$4,398.80/oz gold and US$65.40/oz silver substantially increases the valuation without changing the physical project assumptions.
LOM revenue rises by approximately 25.3% to US$9.82 billion, but the fixed cost structure produces much greater increases further down the cash-flow statement. EBITDA rises by 36.9%, post-tax FCFF by 46.1%, and Project NPV by 51.9% to approximately US$2.84 billion. Project IRR increases to 45.97%, while cash operating margin expands to approximately US$110.84/t.
Almost all of this revaluation is attributable to gold: approximately 96% of the incremental revenue between the two commodity-price scenarios comes from the higher gold price.
The sensitivity analysis nevertheless demonstrates some modelled downside headroom. Across the full +/-20% gold-price and operating-cost matrix, NPV remains positive, ranging from approximately US$903 million to US$2.84 billion.
The most important uncertainties are not the arithmetic of the valuation but the assumptions required to build an economic scenario from an MRE. The modelled production rate is generated using Taylor’s Rule; the 3.5:1 strip ratio and US$850 million initial CAPEX are benchmark estimates; the 2.5% royalty is a modelling assumption; and the sulphide recovery case depends on metallurgical characteristics that require substantially more spatial definition.
The 2026 technical report itself recognizes these uncertainties and recommends further drilling, geometallurgical testing and technical work leading toward a Preliminary Economic Assessment.
Stormlands’ model should consequently be viewed as an illustrative valuation framework for understanding the potential economic scale, commodity-price leverage, operating-margin characteristics and principal value drivers of the Northumberland Mineral Resource before a formal PEA establishes project economics.
About Stormlands
Stormlands Mining is an AI-first valuation and analytics platform for mining assets and critical minerals. The platform helps users turn technical disclosures into interactive valuation models in minutes, rather than days or weeks. The valuation models are accessible over multiple platforms to all users, enabling the user to interact directly with the data to facilitate scenario-planning.
The platform enables users to build discounted cash flow models at scale, test commodity price, capex, opex, tax, royalty rates, discount-rates and production scenarios, and compare opportunities and scenarios.
Stormlands is using this technology to build the Stormlands Library: a global repository of mining asset valuation models. It has moved beyond a tool for analysts building individual models and is developing a data layer for the mining industry: a structured source of valuation models and illustrative scenarios. This creates a new way for investors, corporates, professional advisers, financial-market users and public-policy stakeholders to screen assets, benchmark projects and understand the key drivers of mining asset economics.
If you are interested in accessing the models in the library, email ceo@stormlandsmining.com
Important Notice
This analysis has been prepared by Stormlands Mining using publicly available information from the 2026 NI 43-101 Technical Report for the Northumberland Gold Project together with independent modelling assumptions developed by Stormlands Mining.
The analysis is illustrative only. It is not a Preliminary Economic Assessment, Pre-Feasibility Study, Feasibility Study, Mineral Reserve estimate or independent technical report. Mineral Resources that are not Mineral Reserves do not have demonstrated economic viability. The economic outputs presented are Stormlands-generated estimates and should not be interpreted as project economics published by StrikePoint Gold Inc. or SLR Consulting.
Several material inputs – including production rate, strip ratio, initial and sustaining capital, blended royalty, taxation and discount rate – are not established in the current NI 43-101 and have been estimated for modelling purposes. The Stormlands model also assumes zero dilution, 100% mining recovery and a simplified steady-state production profile.
Future technical work including mine planning, geotechnical studies, additional drilling, geometallurgical testing, processing design, environmental and permitting studies, project-specific capital and operating cost estimation and formal economic assessment would be required before conclusions regarding project development or economic viability could be established.