
Clarence Stream Project
Based on the 2026 NI 43-101 Technical Report, effective May 29, 2026 updated Mineral Resources. and independent modelling by Stormlands Mining
Clarence Stream Project – Gold Antimony – owned by Galway Metals Inc
Introduction
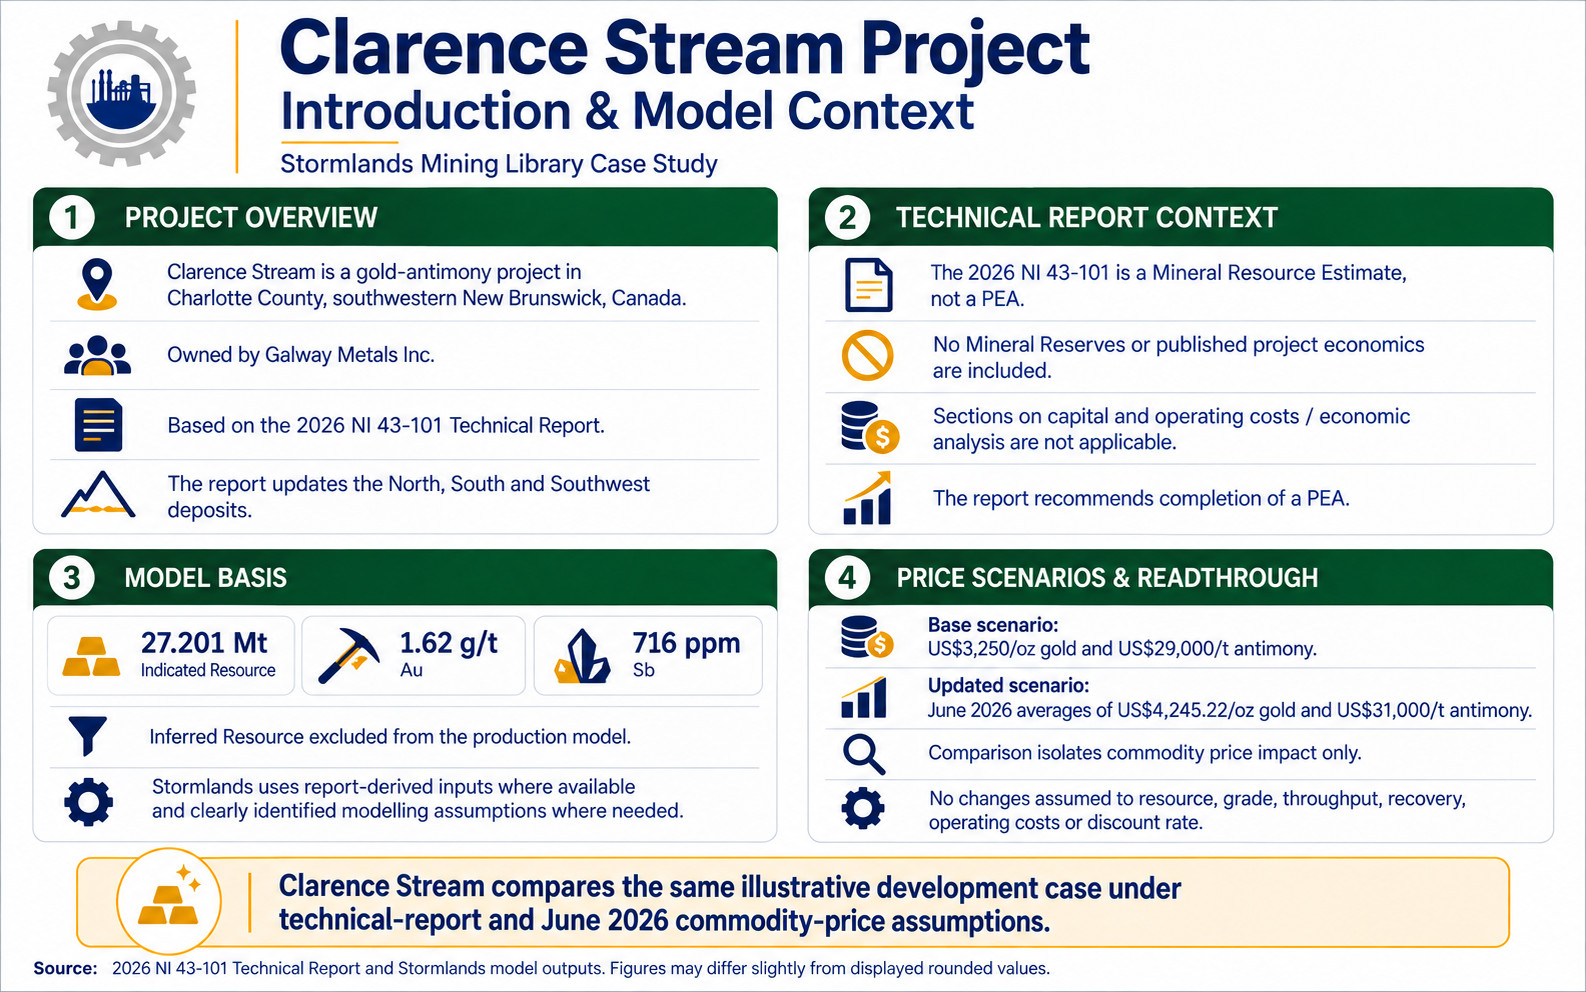
Stormlands Mining has developed an illustrative economic model for the Clarence Stream Project in Charlotte County, southwestern New Brunswick, Canada. The analysis demonstrates how a Mineral Resource Estimate can be converted into a structured valuation framework before a formal project-level economic study has been completed.
Clarence Stream is a gold-antimony project owned by Galway Metals Inc. The 2026 NI 43-101 Technical Report, effective May 29, 2026, reports updated Mineral Resources across the North, South and Southwest deposits. The report does not contain a Preliminary Economic Assessment, Mineral Reserves or published project economics. Sections 21 and 22, covering capital and operating costs and economic analysis, are stated as not applicable, and the report recommends completion of a PEA to evaluate the potential economic viability of the project.
Stormlands created a report-based valuation model using the 27.201 million-tonne Indicated Mineral Resource grading 1.62 g/t gold and 716 ppm antimony. The lower-confidence Inferred Mineral Resource is excluded from the production model.
Where the technical report provides parameters that can be applied to the model, Stormlands uses those values or derives blended assumptions from them. Where essential economic inputs are absent, including production rate, capital cost, strip ratio, mining recovery and dilution, Stormlands uses separately identified modelling assumptions.
The report-based scenario uses the US$3,250/oz gold price and US$29,000/t antimony price applied in the technical report’s Mineral Resource assumptions. A second scenario keeps the same resource, grades, recovery assumptions, production rate, capital costs, operating costs and discount rate, but updates commodity prices to the average used by Stormlands for June 2026: US$4,245.22/oz gold and US$31,000/t antimony.
The comparison therefore isolates the impact of higher commodity prices on the same illustrative development scenario. It does not assume a larger resource, higher grade, increased throughput, improved recovery or lower operating costs.
Project Context
Mineral Resource Estimate
The 2026 NI 43-101 reports:
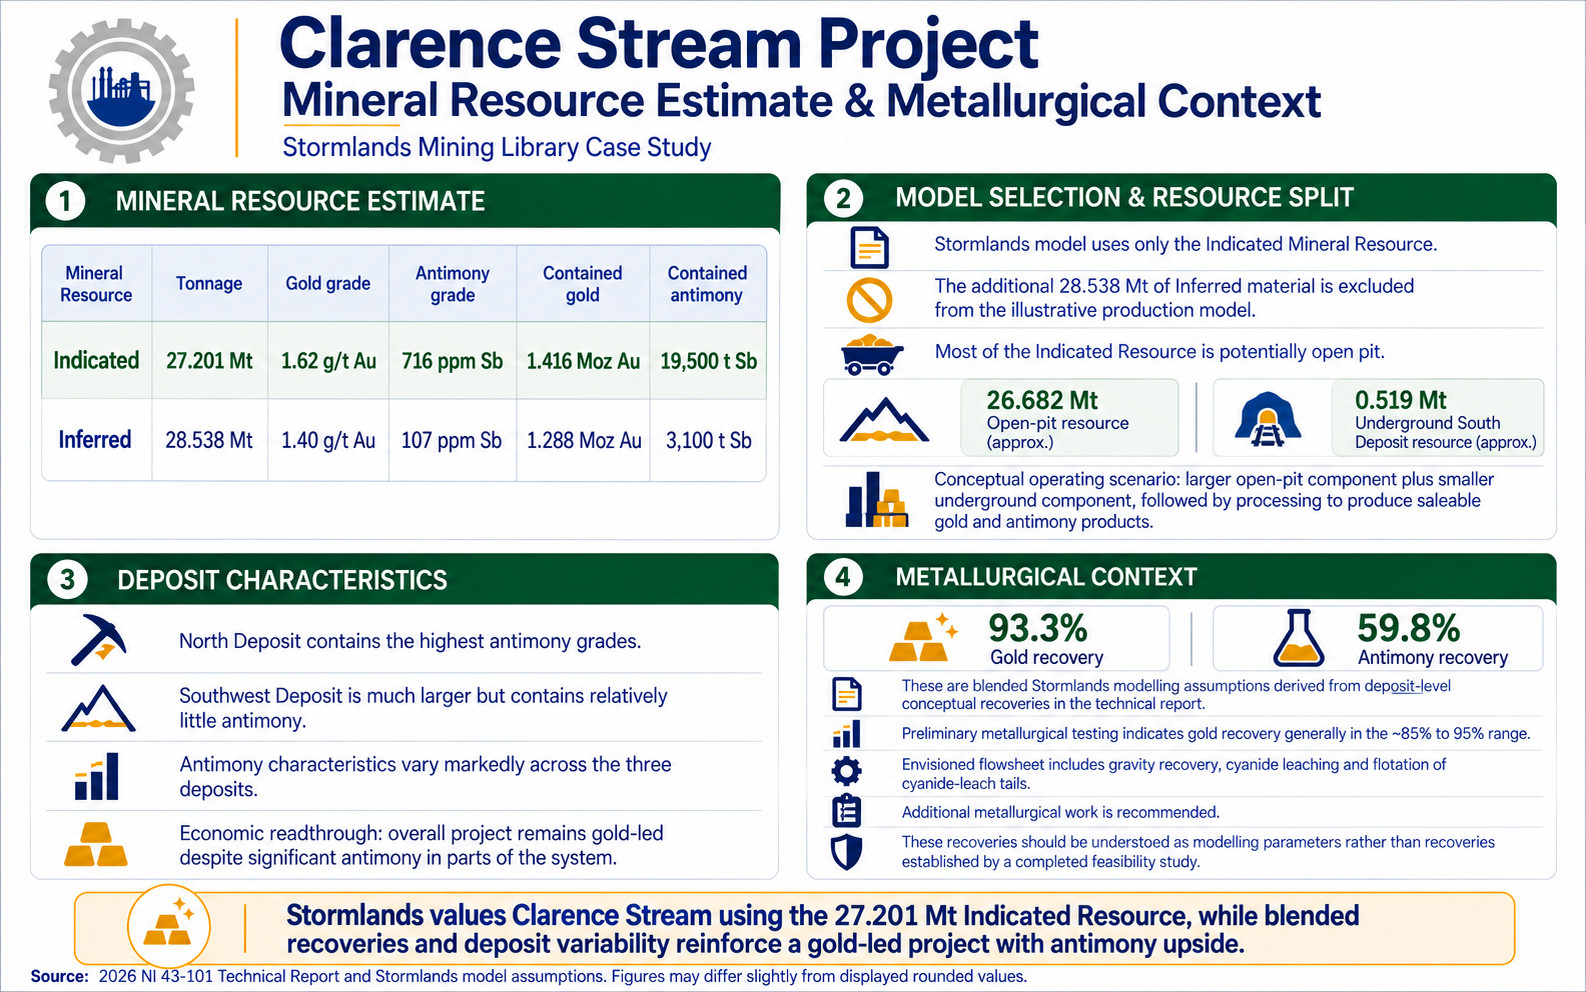
| Mineral Resource | Tonnage | Gold grade | Antimony grade | Contained gold | Contained antimony |
| Indicated | 27.201 Mt | 1.62 g/t Au | 716 ppm Sb | 1.416 Moz Au | 19,500 t Sb |
| Inferred | 28.538 Mt | 1.40 g/t Au | 107 ppm Sb | 1.288 Moz Au | 3,100 t Sb |
The Stormlands model uses only the Indicated Mineral Resource. The additional 28.538 Mt of Inferred material is excluded from the illustrative production model.
Most of the Indicated Resource is classified as potentially open-pit material. 26.682 Mt is reported within the open-pit resource and 0.519 Mt within the underground South Deposit resource. The technical report describes a conceptual operating scenario consisting of a larger open-pit component and a smaller underground component, followed by processing to produce saleable gold and antimony products.
The three deposits have markedly different antimony characteristics. The North Deposit contains the highest antimony grades, while the much larger Southwest Deposit contains relatively little antimony. This becomes important in the economic analysis because the overall resource is gold-led despite the presence of significant antimony in parts of the project.
Metallurgical Context
The technical report applies different conceptual recovery assumptions to each deposit. Stormlands converts these into blended modelling assumptions of 93.3% gold recovery and 59.8% antimony recovery.
The NI 43-101 notes that preliminary metallurgical testing has demonstrated gold recovery generally in the range of approximately 85% to 95% using an envisioned flowsheet incorporating gravity recovery, cyanide leaching and flotation of cyanide-leach tails. Additional metallurgical work is recommended.
These recoveries should therefore be understood as modelling parameters derived from the Mineral Resource work rather than recoveries established through a completed project feasibility study.
Model Basis
Physical and Production Assumptions
| Assumption | Stormlands Model |
| Indicated Mineral Resource used | 27.201 Mt |
| Gold grade | 1.62 g/t Au |
| Antimony grade | 716 ppm Sb |
| Mining recovery | 95% |
| Mining dilution | 10% |
| Gold metallurgical recovery | 93.3% |
| Antimony metallurgical recovery | 59.8% |
| Daily production rate | 1,125 tpd |
| Annual production rate | 410,625 tpa |
| Modelled mine life | 69.2 years |
The production rate is not published in the NI 43-101. It is generated independently by the Stormlands modelling process using Taylor’s Rule and is discussed in more detail under Production Rate and Mine Life below.
Economic Assumptions
| Assumption | Report-Based Case | Updated Commodity-Price Case |
| Gold price | US$3,250/oz | US$4,245.22/oz |
| Antimony price | US$29,000/t | US$31,000/t |
| Initial development CAPEX | US$92.6m | US$92.6m |
| LOM CAPEX incl. sustaining capital | US$246.0m | US$246.0m |
| Modelled OPEX | US$48.83/t | US$48.83/t |
| Commercial royalty | 1% | 1% |
| Corporate income-tax assumption | 29% | 29% |
| Discount rate | 5% | 5% |
The US$92.6 million initial capital assumption corresponds to approximately C$125 million at the 1.35 C$/US$ exchange rate used by the model. Initial and sustaining capital are not provided in the NI 43-101 and have therefore been independently estimated for the Stormlands model.
Key Highlights
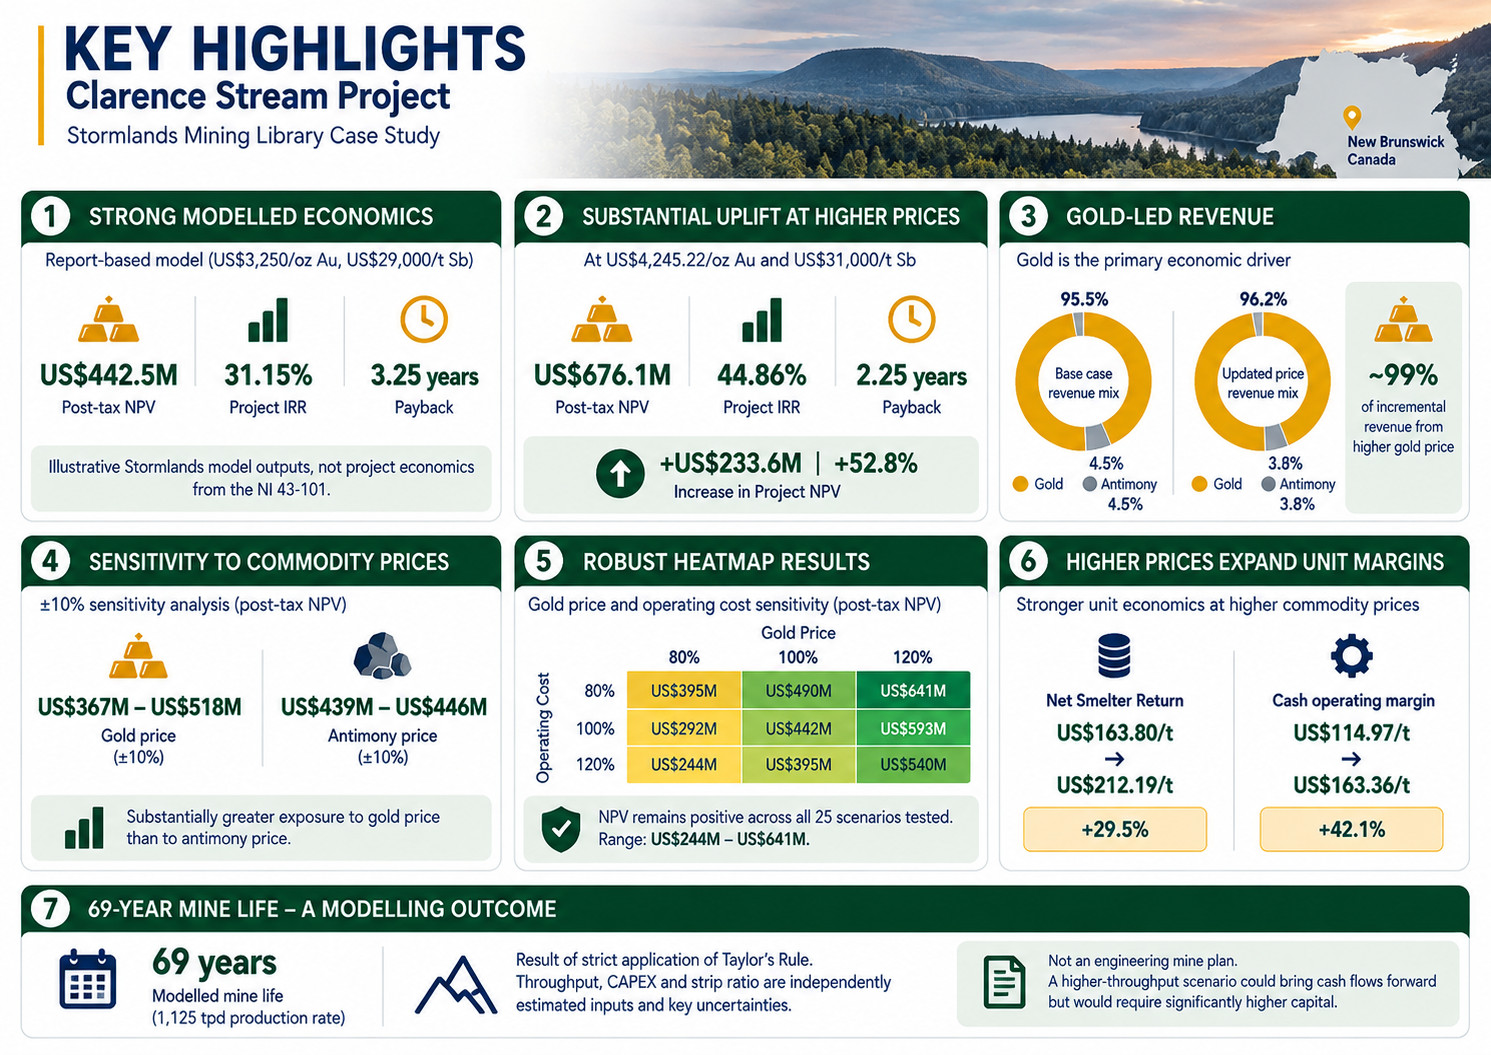
Stormlands’ report-based model produces a post-tax Project NPV of approximately US$442.5 million, Project IRR of 31.15% and payback of approximately three years and three months. These are Stormlands-generated illustrative outputs rather than project economics published in the NI 43-101.
Updating commodity prices increases Project NPV by US$233.6 million, or 52.8%. At US$4,245.22/oz gold and US$31,000/t antimony, Project NPV increases to approximately US$676.1 million, IRR rises to 44.86% and payback shortens to approximately two years and three months.
Gold is overwhelmingly the principal economic driver. Approximately 95.5% of report-based LOM revenue comes from gold. In the updated scenario this rises to approximately 96.2%, and almost 99% of the incremental revenue between the two scenarios is attributable to the higher gold price.
The ±10% sensitivity analysis shows substantially greater exposure to gold price than to antimony price. Gold-price sensitivity produces NPVs of approximately US$367 million to US$518 million, compared with approximately US$439 million to US$446 million for equivalent percentage changes in antimony price.
The combined gold-price and operating-cost heatmap remains NPV-positive across all 25 scenarios tested. NPV ranges from approximately US$244 million at 80% gold price and 120% operating cost to approximately US$641 million at 120% gold price and 80% operating cost.
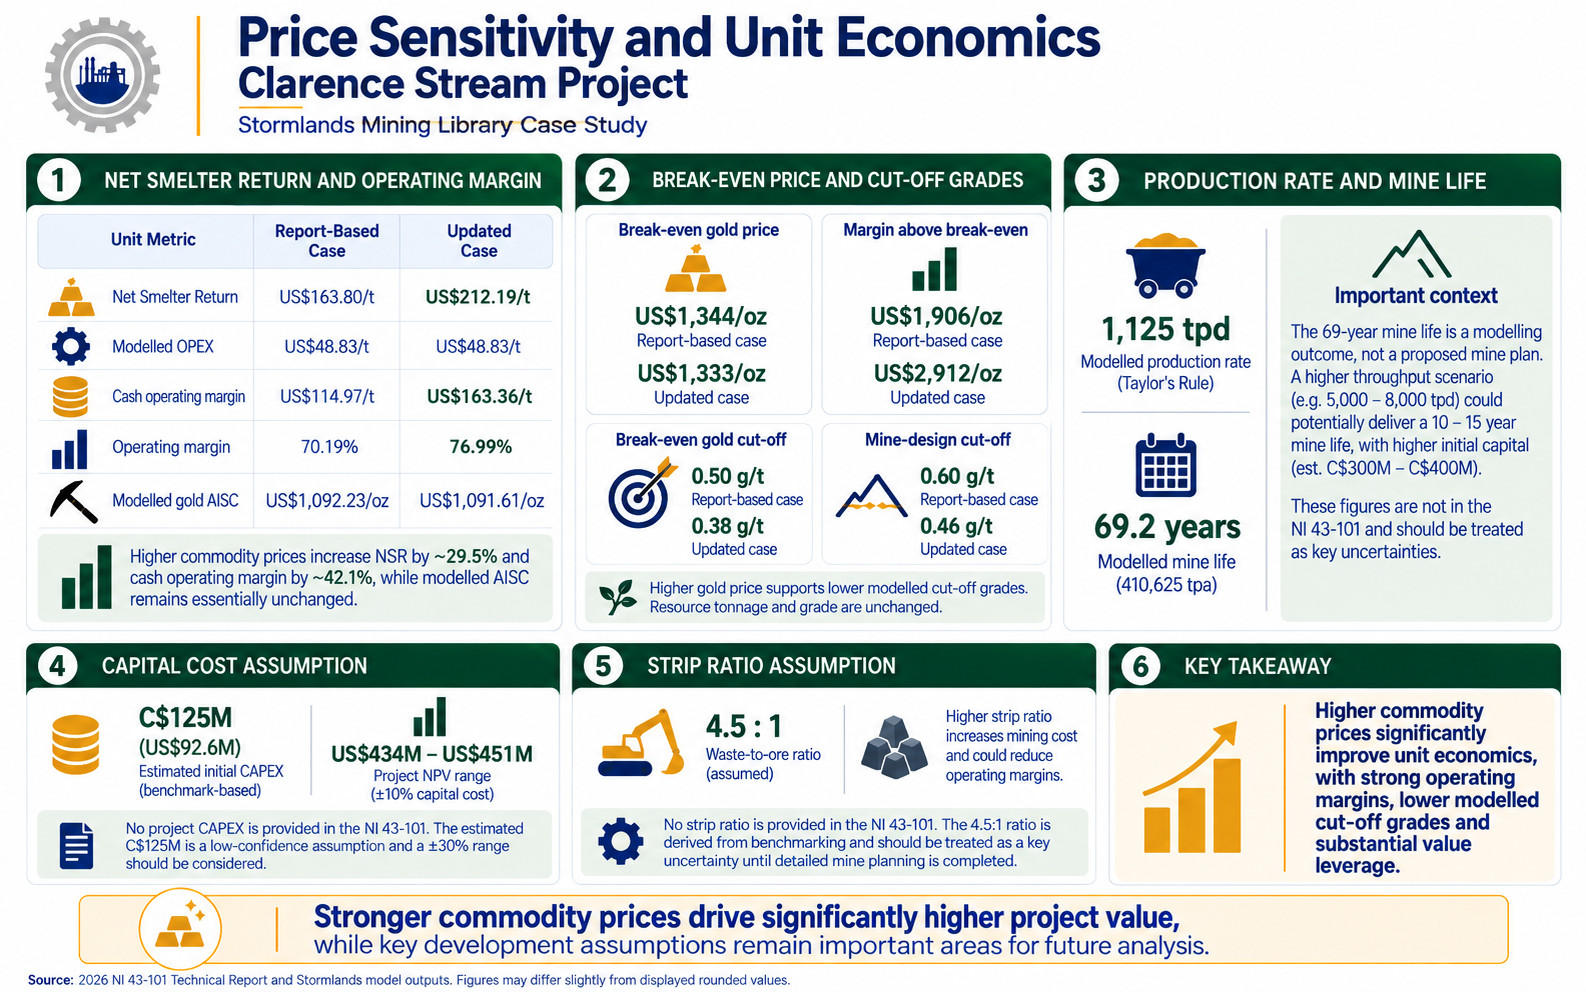
Higher commodity prices expand modelled unit margins materially. Net Smelter Return increases from approximately US$163.80/t to US$212.19/t, while cash operating margin rises from US$114.97/t to US$163.36/t.
The 69-year mine life is a modelling outcome rather than an engineering mine plan. It results from strict application of Taylor’s Rule to derive a production rate of 1,125 tpd. Throughput, CAPEX and strip ratio are among the most important independently estimated inputs and should be treated as key uncertainties until project-level engineering is completed.
Project NPV and Returns
The report-based model generates positive illustrative economics using the commodity-price assumptions adopted in the 2026 Mineral Resource Estimate.
Updating the commodity prices while leaving all physical and cost assumptions unchanged produces a substantial increase in value.
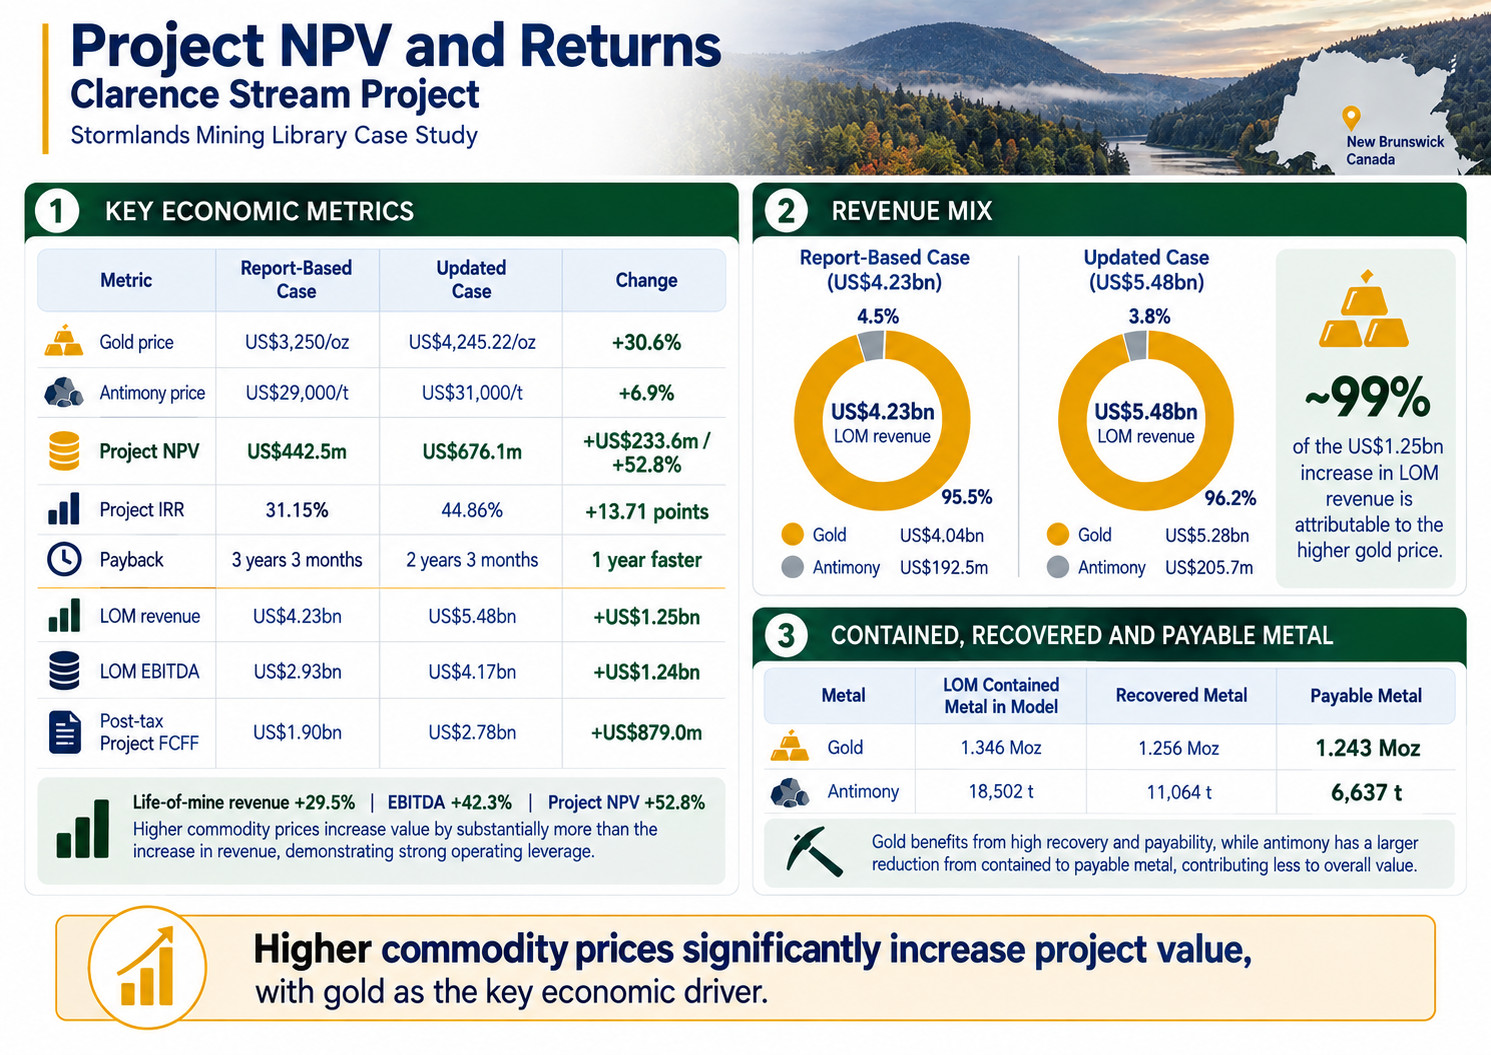
| Metric | Report-Based Case | Updated Case | Change |
| Gold price | US$3,250/oz | US$4,245.22/oz | +30.6% |
| Antimony price | US$29,000/t | US$31,000/t | +6.9% |
| Project NPV | US$442.5m | US$676.1m | +US$233.6m / +52.8% |
| Project IRR | 31.15% | 44.86% | +13.71 points |
| Payback | 3 years 3 months | 2 years 3 months | 1 year faster |
| LOM revenue | US$4.23bn | US$5.48bn | +US$1.25bn |
| LOM EBITDA | US$2.93bn | US$4.17bn | +US$1.24bn |
| Post-tax Project FCFF | US$1.90bn | US$2.78bn | +US$879.0m |
Life-of-mine revenue increases by approximately 29.5%, while EBITDA increases by approximately 42.3% and Project NPV increases by approximately 52.8%.
This reflects the operating leverage created when commodity prices rise but the assumed physical production plan and cost base remain unchanged. Higher prices therefore increase the value retained after operating and capital costs by substantially more than the percentage increase in revenue.
The approximately 30.6% increase in gold price accounts for the great majority of this revaluation. Antimony prices increase by only 6.9%, and antimony represents a relatively small share of modeled revenue.
Revenue Mix
Revenue Mix
In the report-based case, Stormlands models approximately US$4.04 billion of gold revenue and US$192.5 million of antimony revenue.
Under updated commodity prices, gold revenue increases to approximately US$5.28 billion, while antimony revenue increases to approximately US$205.7 million.
| Revenue | Report-Based Case | Updated Case |
| Gold | US$4.04bn | US$5.28bn |
| Antimony | US$192.5m | US$205.7m |
| Total | US$4.23bn | US$5.48bn |
| Gold share | 95.5% | 96.2% |
| Antimony share | 4.5% | 3.8% |
Of the approximately US$1.25 billion increase in LOM revenue, around 98.9% is attributable to gold.
The result characterises Clarence Stream, within the Stormlands model, as primarily a gold-led project with an antimony revenue contribution, rather than a valuation dependent equally on both commodities.
This is consistent with the resource distribution. Antimony is concentrated particularly strongly within the relatively small North Deposit, whereas the substantially larger Southwest Deposit has low reported antimony grades.
Contained, Recovered and Payable Metal
The Stormlands model progressively applies mining recovery, metallurgical recovery and payability assumptions to the resource inventory.
| Metal | LOM Contained Metal in Model | Recovered Metal | Payable Metal |
| Gold | 1.346 Moz | 1.256 Moz | 1.243 Moz |
| Antimony | 18,502 t | 11,064 t | 6,637 t |
The technical report contains approximately 1.416 Moz gold and 19,500 tonnes antimony in the Indicated Mineral Resource. The lower values appearing as “LOM Contained Metal” in the Stormlands output are consistent with the model’s 95% mining-recovery assumption being applied before metallurgical recovery.
Gold then benefits from the relatively high 93.3% blended metallurgical recovery and 99% payability assumption. Antimony has a much larger reduction from geological contained metal to payable metal because the model applies 59.8% metallurgical recovery followed by 60% payability.
This difference is another reason why movements in antimony price have considerably less influence on NPV than equivalent movements in gold price.
Price sensitivity and value drivers
Net Smelter Return and Operating Margin
| Unit Metric | Report-Based Case | Updated Case |
| Net Smelter Return | US$163.80/t | US$212.19/t |
| Modelled OPEX | US$48.83/t | US$48.83/t |
| Cash operating margin | US$114.97/t | US$163.36/t |
| Operating margin | 70.19% | 76.99% |
| Modelled gold AISC | US$1,092.23/oz | US$1,091.61/oz |
Because the physical and cost assumptions are unchanged, modelled OPEX remains at US$48.83/t in both cases.
The higher commodity prices increase NSR by approximately US$48.39/t, or 29.5%, and cash operating margin increases by approximately US$48.39/t, or 42.1%.
The operating-margin percentage consequently increases from approximately 70.2% to 77.0%.
Modelled gold AISC remains essentially unchanged at approximately US$1,092/oz because the assumed operating configuration is unchanged.
The implied margin between gold price and modelled AISC increases from approximately US$2,158/oz in the report-based scenario to approximately US$3,154/oz using the updated commodity price.
The AISC calculation is a Stormlands model output and should not be interpreted as an engineering cost estimate published by Galway Metals or SLR.
Break-Even Price and Cut-Off Grades
The modelled break-even gold price is approximately US$1,344/oz in the report-based scenario and approximately US$1,333/oz under the updated commodity-price scenario.
The principal difference lies in the margin between the assumed gold price and break-even price.
The report-based US$3,250/oz gold price is approximately US$1,906/oz above modeled break-even, while the updated US$4,245.22/oz price is approximately US$2,912/oz above modeled break-even.
The Stormlands break-even gold cut-off grade falls from approximately 0.50 g/t to 0.38 g/t, while the modelled mine-design cut-off falls from approximately 0.60 g/t to 0.46 g/t.
The updated model does not re-estimate the Mineral Resource, pit shells, underground shapes or mine inventory at these lower modelled cut-off grades. The resource tonnage and grade are identical in both scenarios. Consequently, the updated case is a revaluation of the same resource inventory, rather than a model of any additional material that might potentially become economic at higher commodity prices.
Production Rate and Mine Life
The modelled 69.2-year mine life requires particular qualification.
The 2026 NI 43-101 does not establish a project production rate. To populate this missing input, the Stormlands model-build process applied Taylor’s Rule to the 27.201 Mt Indicated resource.
The calculation produces approximately 1,125 tonnes per day, equivalent to 410,625 tonnes per year. Applying that production rate to the modelled inventory results in a mine life of approximately 69 years.
Taylor’s Rule Distortion — Inferred, Low Confidence
The resulting mine life should not be interpreted as a proposed 69-year mine plan.
It is the mathematical consequence of applying a standardized production-rate rule to the selected resource. The model-build assessment identifies this as a low-confidence inferred assumption and notes that a project containing approximately 27.2 Mt of mineralized material could potentially be evaluated at a substantially higher processing rate.
For scenario context, the model-build record identifies approximately 5,000 to 8,000 tpd as a possible range to investigate, which could place the operating period broadly within a 10- to 15-year range. Neither this throughput range nor the resulting mine life is contained in the NI 43-101 and neither should be interpreted as a forecast of how Galway Metals will develop Clarence Stream.
A higher-throughput development scenario would bring a greater proportion of the project’s cash flow forward, reducing the effect of discounting on distant production. This could materially increase NPV, but higher throughput would also be expected to require substantially greater initial capital.
The model-build assessment identifies approximately C$300 million to C$400 million as a low-confidence indicative capital range for such a higher-throughput scenario. This figure has not been established by engineering and is not used in the current Stormlands valuation.
The relationship between throughput, initial capital and cash-flow timing is therefore an important area for future scenario analysis.
Capital and Strip Ratio Assumptions
Capital Cost
The NI 43-101 does not provide project CAPEX. Stormlands therefore uses an independently estimated initial development cost of approximately C$125 million, equivalent to US$92.6 million at the exchange rate applied in the model.
This estimate was developed using benchmark-based scaling rather than detailed Clarence Stream engineering.
The ±10% sensitivity analysis produces Project NPVs between approximately US$434 million and US$451 million when capital cost is varied independently.
This indicates relatively limited NPV sensitivity within the narrow ±10% range tested. However, the uncertainty around the underlying capital estimate may be materially wider than ±10%. The model-build assessment flags a range of approximately ±30% as relevant for considering uncertainty in the benchmark-derived C$125 million estimate.
A wider capital range could have a more significant effect on IRR, financing requirements and payback than is visible in the standard ±10% sensitivity chart.
Strip Ratio
The NI 43-101 does not publish a project mine plan or life-of-mine strip ratio. Stormlands therefore assumes a 4.5:1 waste-to-ore strip ratio, derived from benchmarking comparable Canadian open-pit gold operations.
The strip ratio has a direct relationship with mining cost: more waste movement for each tonne of ore increases total mining expenditure.
Consequently, if future mine design demonstrates a materially higher strip ratio than the current assumption, particularly around the South or Southwest deposits, modelled operating margins would be lower. Conversely, a lower strip ratio would improve operating economics.
The operating-cost sensitivity and heatmaps provide a way of evaluating this uncertainty without implying that the 4.5:1 estimate has been demonstrated by detailed mine planning.
Stormlands Sensitivity Analysis
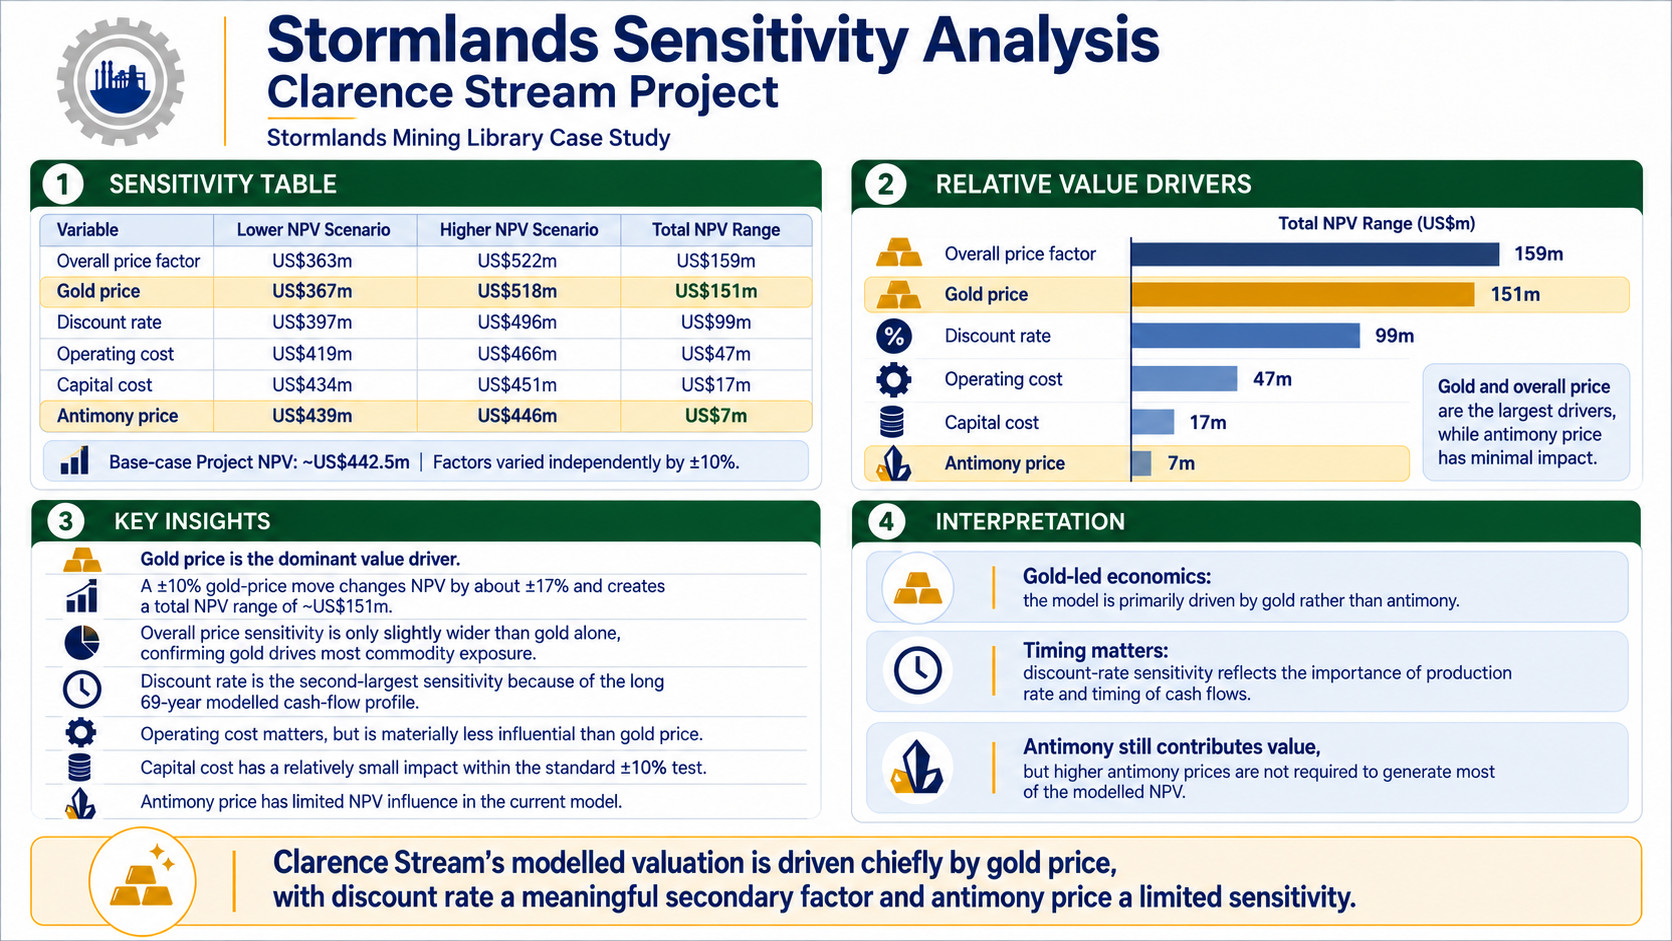
Stormlands’ standard sensitivity analysis begins with a base-case Project NPV of US$442.5 million and independently increases or decreases each tested factor by 10%, holding the remaining assumptions constant.
| Variable | Lower NPV Scenario | Higher NPV Scenario | Total NPV Range |
| Overall price factor | US$363m | US$522m | US$159m |
| Gold price | US$367m | US$518m | US$151m |
| Discount rate | US$397m | US$496m | US$99m |
| Operating cost | US$419m | US$466m | US$47m |
| Capital cost | US$434m | US$451m | US$17m |
| Antimony price | US$439m | US$446m | US$7m |
Gold Price is the Dominant Value Driver
A ±10% movement in gold price changes Project NPV by approximately ±17%, producing a total NPV range of approximately US$151 million.
The overall commodity-price sensitivity is only slightly wider than gold price alone. This confirms that most of the project’s commodity-price exposure is attributable to gold.
Discount Rate is the Second-Largest Sensitivity
The discount-rate test produces NPVs between approximately US$397 million and US$496 million.
This sensitivity is particularly relevant because of the modelled 69-year cash-flow profile. A substantial proportion of the resource is processed many years into the future and is therefore heavily affected by discounting.
The result reinforces why production rate and cash-flow timing are important modelling uncertainties for Clarence Stream.
Operating Cost has a Material but Smaller Effect
A ±10% movement in operating cost produces NPVs between approximately US$419 million and US$466 million, equivalent to a total range of approximately US$47 million.
Operating cost is therefore substantially less influential than gold price in the current model, but it remains an important controllable value driver and is directly relevant to uncertainty around the assumed strip ratio.
Antimony Price has Limited NPV Influence
A ±10% movement in antimony price produces NPVs of approximately US$439 million to US$446 million, a total range of only about US$7 million.
The result is consistent with antimony representing approximately 4.5% of report-based modeled revenue.
This does not mean antimony has no value. It contributes an additional revenue stream and is locally significant within the resource. It does mean that Clarence Stream’s current Stormlands valuation is not dependent on higher antimony prices to generate the majority of its modeled value.
Stormlands Heatmap
Gold Price and Operating Cost
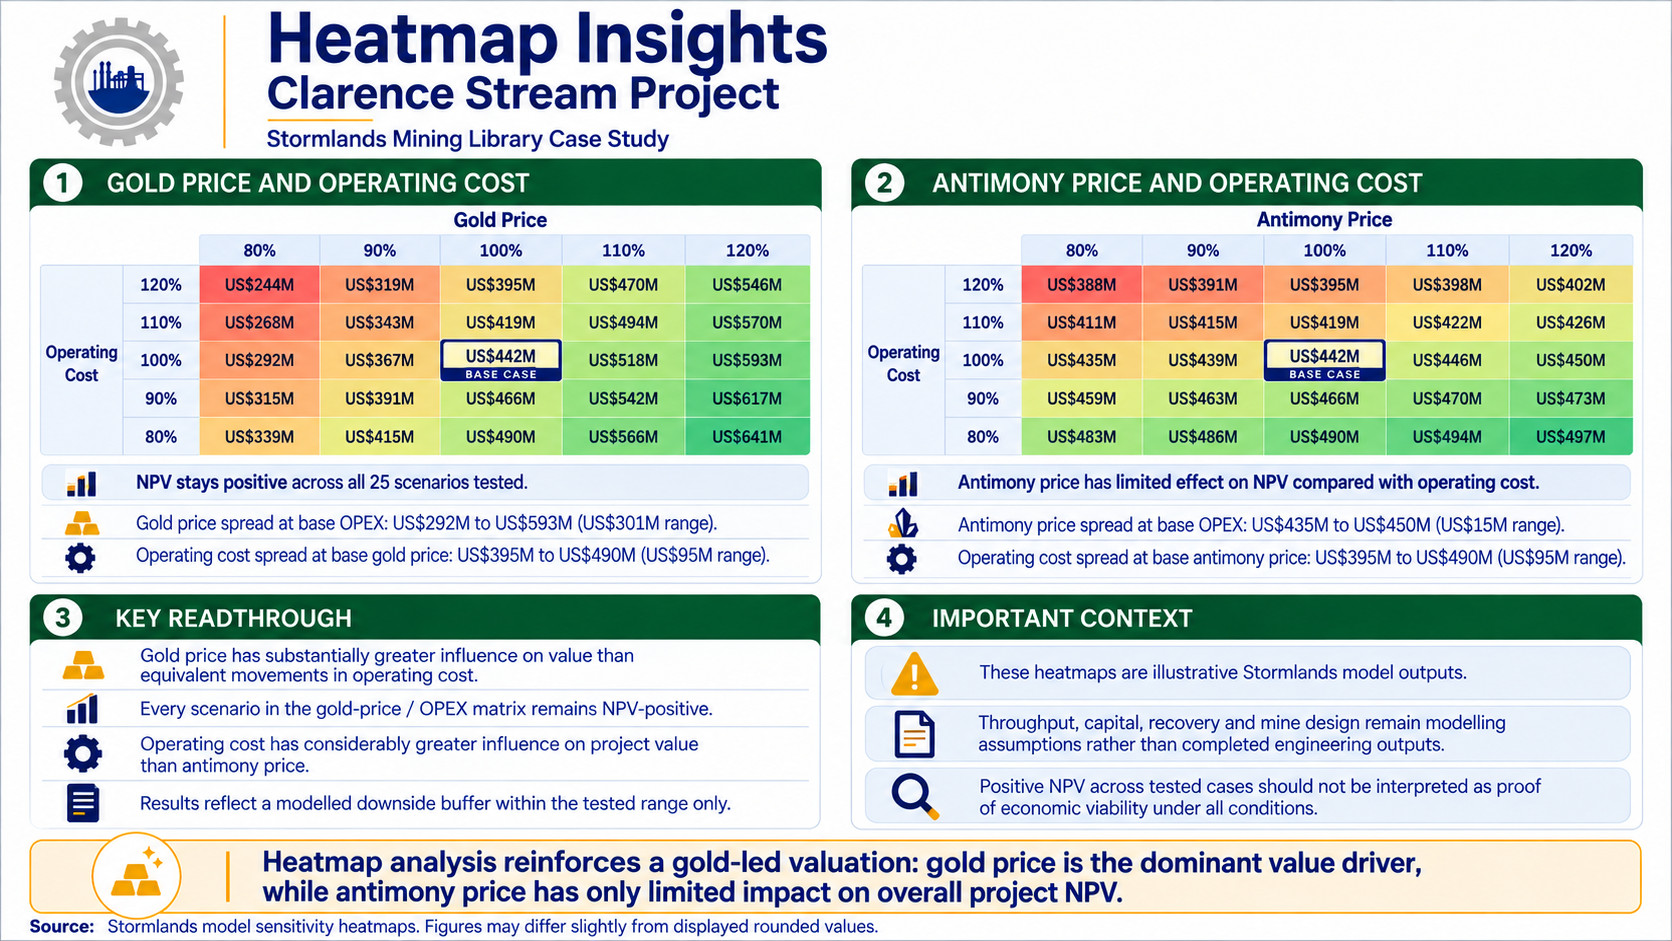
The first heatmap tests gold price and operating cost simultaneously, varying both between 80% and 120% of their base assumptions.
The central scenario is approximately US$442 million NPV at 100% gold price and 100% operating cost.
Across the complete 25-scenario matrix, Project NPV ranges from :
US$244 million at 80% gold price and 120% operating cost
to
US$641 million at 120% gold price and 80% operating cost.
At the base operating cost, reducing gold price by 20% decreases NPV to US$292 million, while increasing gold price by 20% raises NPV to US$593 million.
This creates an US$301 million NPV spread from gold price alone across the ±20% range.
At the base gold price, increasing operating cost by 20% decreases NPV to approximately US$395 million, while reducing operating cost by 20% raises NPV to US$490 million—an US$95 million spread.
Gold price therefore has substantially greater influence on value than equivalent percentage movements in operating cost.
Importantly, every scenario within the tested gold-price/OPEX matrix remains NPV-positive. This indicates modelled downside headroom within the specific range tested. It should not be interpreted as proof of economic viability under all potential combinations of technical and market conditions, particularly because throughput, capital, recovery and mine design remain assumptions rather than completed engineering outputs.
Antimony Price and Operating Cost
The second heatmap varies antimony price and operating cost simultaneously over the same 80% to 120% ranges.
At base operating cost, reducing antimony price by 20% results in NPV of approximately US$435 million, while increasing it by 20% raises NPV to approximately US$450 million.
The total NPV spread attributable to a 40-percentage-point antimony-price range is therefore only about US$15 million.
By comparison, holding antimony at its base price and moving operating cost from 120% to 80% changes NPV from approximately US$395 million to US$490 million.
Across the full matrix, NPV ranges from approximately US$388 million at 80% antimony price and 120% operating cost to approximately US$497 million at 120% antimony price and 80% operating cost.
The heatmap therefore confirms that operating cost has considerably greater influence on project value than antimony price within the ranges tested.
Value Drivers and Model Uncertainty
| Value Driver | Stormlands Observation | Principal Qualification |
| Gold price | Dominant commodity driver; updated pricing increases NPV by 52.8% | Future gold prices remain uncertain |
| Resource scale | 27.201 Mt Indicated resource provides a substantial modelled production inventory | Inferred resource excluded; no Reserve established |
| Antimony | Adds revenue but contributes only c.4–5% of modelled total | Recovery, payability, concentrate specifications and future antimony market require further study |
| Production rate | 1,125 tpd generates a very long cash-flow profile | Taylor’s Rule output, not an engineering mine plan |
| CAPEX | Current US$92.6m initial capital supports strong modelled returns | Benchmark estimate; not provided by the NI 43-101 |
| Operating cost / strip ratio | Current model shows significant operating margin | 4.5:1 strip ratio is benchmark-derived and has not been established through mine design |
| Discounting | Long mine life makes NPV particularly sensitive to timing of cash flows | Higher throughput could bring value forward but would require higher capital |
The key distinction is between the relatively well-defined geological resource and the less-defined development scenario.
The tonnage, grades and resource classifications are established in the 2026 NI 43-101. Several of the commodity-price, recovery and unit-cost parameters are also anchored to assumptions used in the Mineral Resource analysis. However, the project has not yet advanced to the point where throughput, mine schedule, strip ratio or capital costs have been established through a PEA or more advanced engineering study.
The Stormlands model is designed to bridge this information gap transparently rather than to imply that the missing engineering work has already been completed.
Conclusion
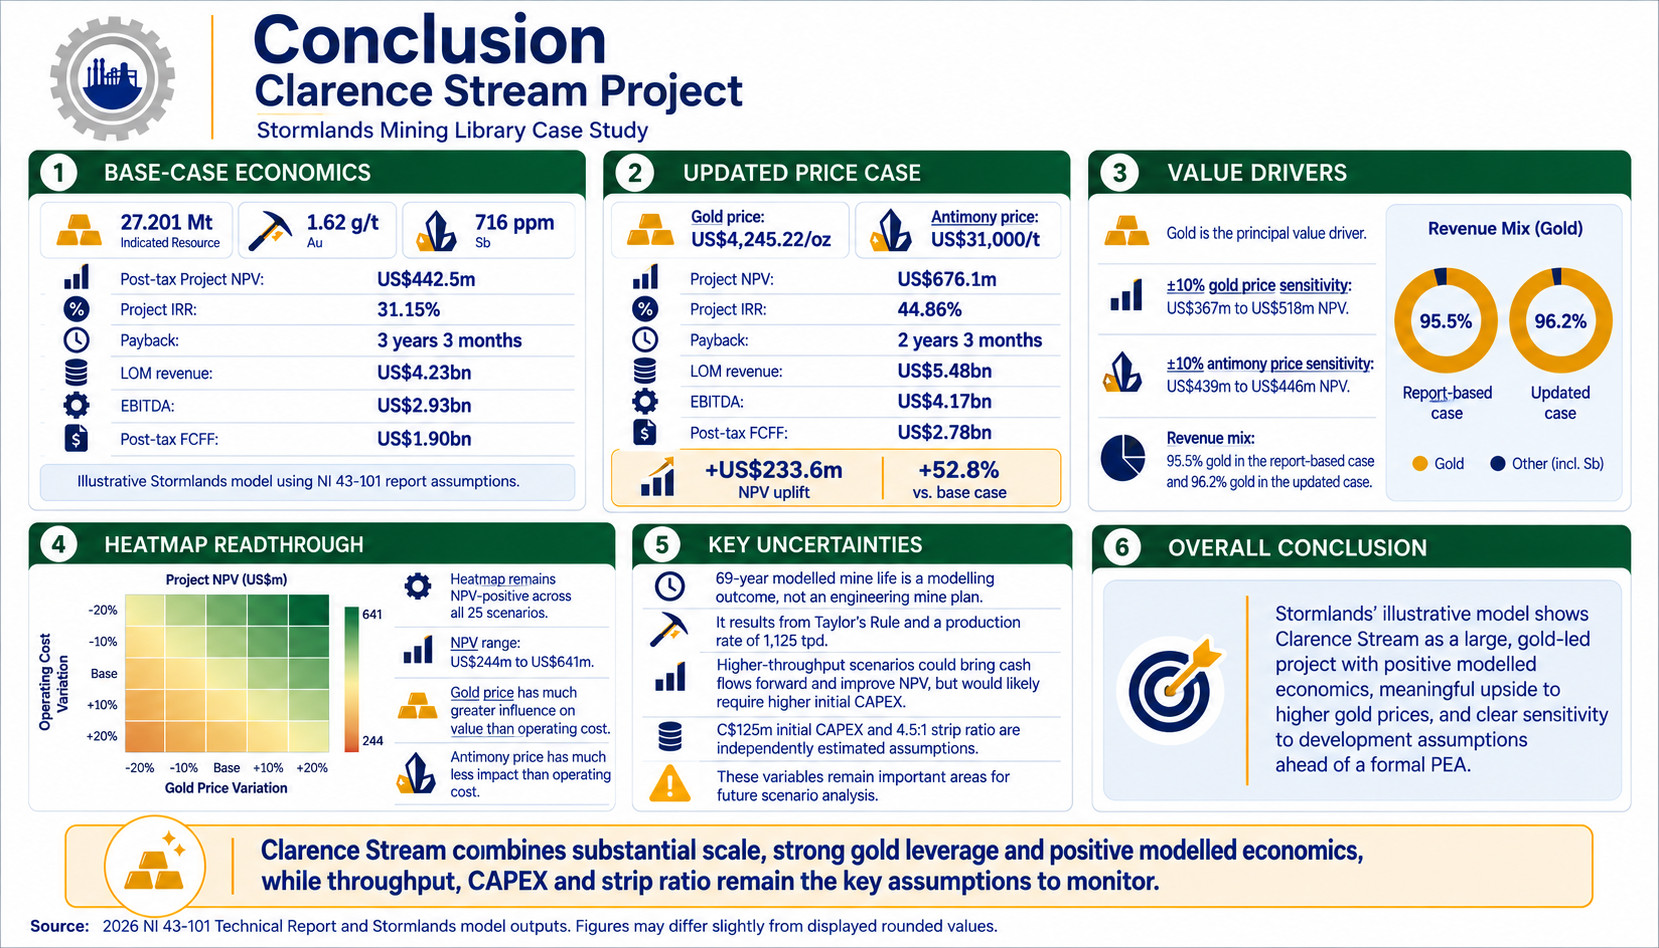
Stormlands’ illustrative model of the Clarence Stream Project shows a large, gold-led resource with positive modeled economics and substantial leverage to gold price.
Using the 27.201 Mt Indicated Mineral Resource grading 1.62 g/t gold and 716 ppm antimony, together with the US$3,250/oz gold and US$29,000/t antimony prices used in the 2026 technical report’s Mineral Resource assumptions, the Stormlands model produces a post-tax Project NPV of approximately US$442.5 million, Project IRR of 31.15% and payback of approximately three years and three months.
The model generates approximately US$4.23 billion of life-of-mine revenue, US$2.93 billion of EBITDA and US$1.90 billion of post-tax Project free cash flow.
Under the updated commodity-price scenario of US$4,245.22/oz gold and US$31,000/t antimony, Project NPV increases by approximately US$233.6 million to US$676.1 million, a 52.8% uplift. Project IRR increases to 44.86%, payback shortens by approximately one year, LOM revenue rises to approximately US$5.48 billion, EBITDA increases to US$4.17 billion, and post-tax Project free cash flow rises to approximately US$2.78 billion.
The sensitivity analysis demonstrates that gold is the principal value driver. A ±10% movement in gold price produces NPVs between approximately US$367 million and US$518 million, whereas an equivalent movement in antimony price produces NPVs between approximately US$439 million and US$446 million. Gold contributes approximately 95.5% of report-based revenue and approximately 96.2% in the updated case.
The heatmap analysis also shows material modelled downside headroom. Across the simultaneous ±20% gold-price and operating-cost scenarios tested, NPV remains positive and ranges from approximately US$244 million to US$641 million.
The principal uncertainties lie in the development assumptions rather than the arithmetic of the valuation. The 69-year modelled mine life results from strict application of Taylor’s Rule, generating a production rate of only 1,125 tpd. It is not a mine life proposed in the NI 43-101. Higher-throughput scenarios could potentially bring cash flows forward and increase present value, but would also require materially higher capital investment.
Similarly, the C$125 million initial CAPEX and 4.5:1 strip ratio are independently estimated assumptions rather than figures established by Clarence Stream engineering. These variables should therefore remain central to future scenario analysis.
The Stormlands model consequently provides an illustrative valuation framework for understanding Clarence Stream’s resource scale, commodity-price leverage, operating-margin potential and key economic sensitivities before a formal PEA establishes project economics.
About Stormlands
Stormlands Mining is an AI-first valuation and analytics platform for mining assets and critical minerals. The platform helps users turn technical disclosures into interactive valuation models in minutes, rather than days or weeks. The valuation models are accessible over multiple platforms to all users, enabling the user to interact directly with the data to facilitate scenario-planning.
The platform enables users to build discounted cash flow models at scale, test commodity price, capex, opex, tax, royalty rates, discount-rates and production scenarios, and compare opportunities and scenarios.
Stormlands is using this technology to build the Stormlands Library: a global repository of mining asset valuation models. It has moved beyond a tool for analysts building individual models and is developing a data layer for the mining industry: a structured source of valuation models and illustrative scenarios. This creates a new way for investors, corporates, professional advisers, financial-market users and public-policy stakeholders to screen assets, benchmark projects and understand the key drivers of mining asset economics.
If you are interested in accessing the models in the library, email ceo@stormlandsmining.com
Important Notice
This analysis has been prepared by Stormlands Mining using publicly available information from the NI 43-101 Technical Report together with Stormlands’ own independent modelling assumptions.
The analysis is illustrative only. It is not a Preliminary Economic Assessment, Pre-Feasibility Study, Feasibility Study, Mineral Reserve estimate or independent technical report. It has not been prepared on behalf of the project owner and has not been reviewed or approved by the project owner.
The model outputs are Stormlands-generated illustrative estimates only. They should not be interpreted as demonstrated economic viability. Future technical work, including mine planning, metallurgical testing, engineering, environmental studies, permitting, capital-cost estimation and operating-cost estimation, would be required before any formal economic conclusions could be drawn.